Alarm Management
Overview
Applicable Role: Tenant Administrator.
Alarm Management is a functional module in the ThingsEye platform used to monitor device data anomalies and notify relevant personnel in a timely manner. Tenant Administrators can configure alarm rules to define automatic triggering when device‑reported data meets specific conditions (e.g., temperature exceeds a threshold, device goes offline, etc.). Through the alarm console, administrators can acknowledge, clear, and add comments to alarms, completing the closed‑loop lifecycle management of alarms.
Important Notes: Alarm rules depend on telemetry data reported by devices or assets (e.g., temperature, humidity, status, etc.). If a device is not configured to report data or the data format does not match, the alarm rules will not be triggered. Alarm processing operations (acknowledgment, clearing) are recorded in the audit log for traceability.
1. Configure Alarm Rules
Procedure
Step 1: Go to the alarm rule configuration page
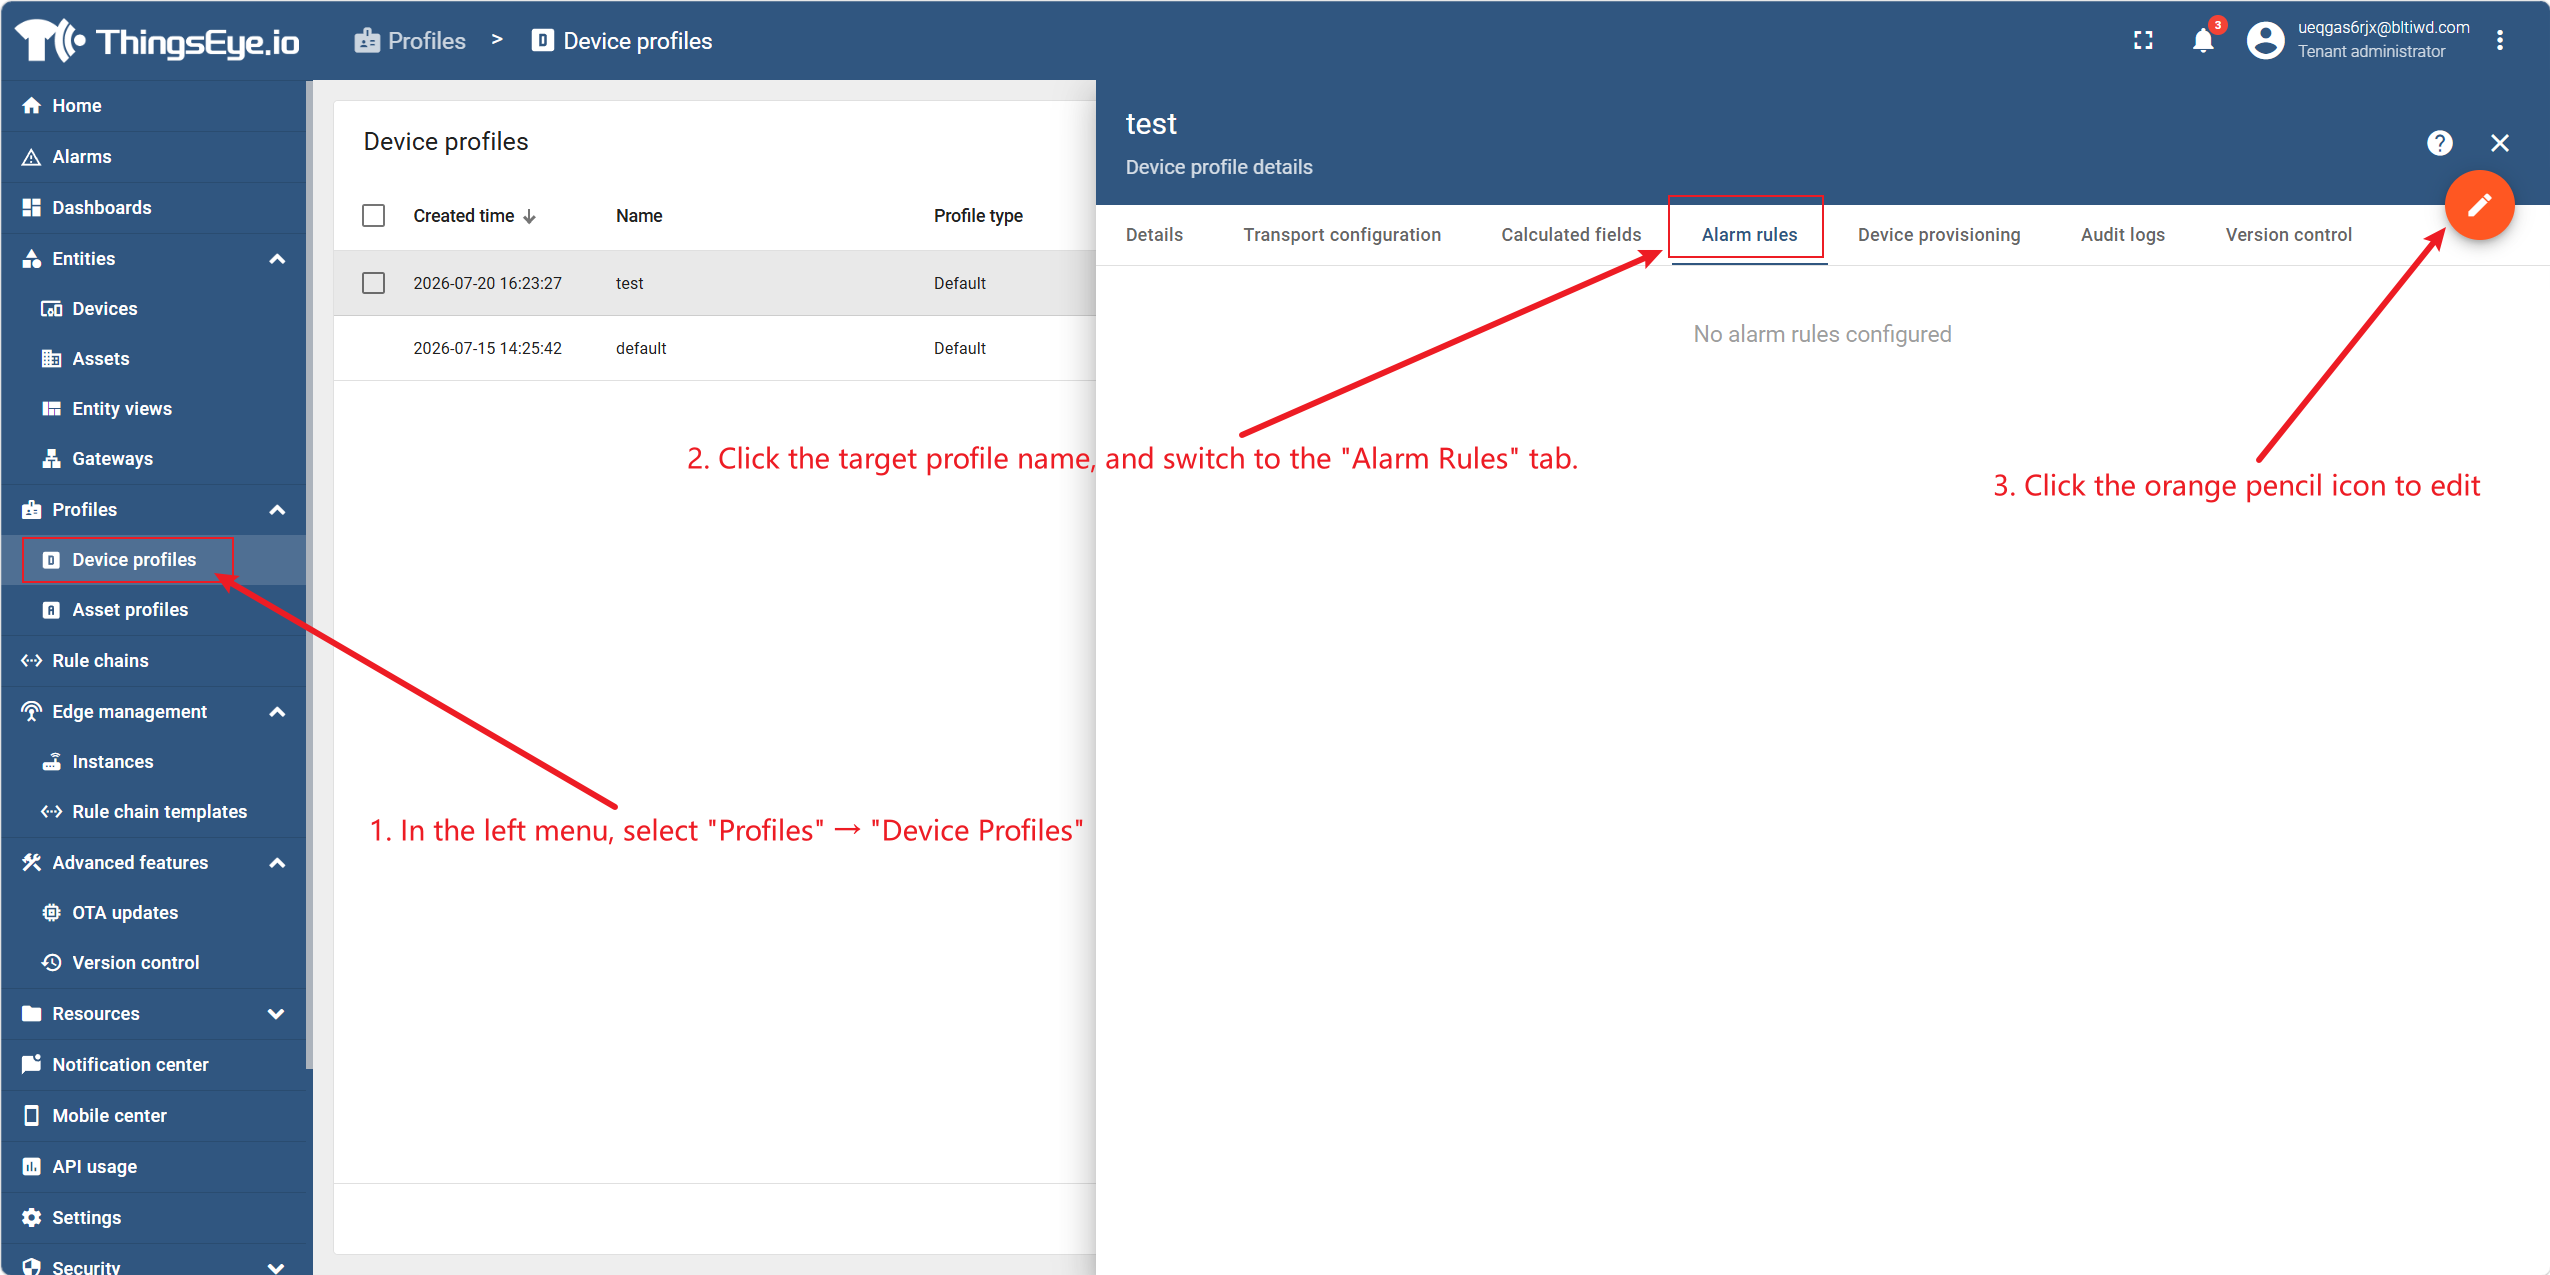
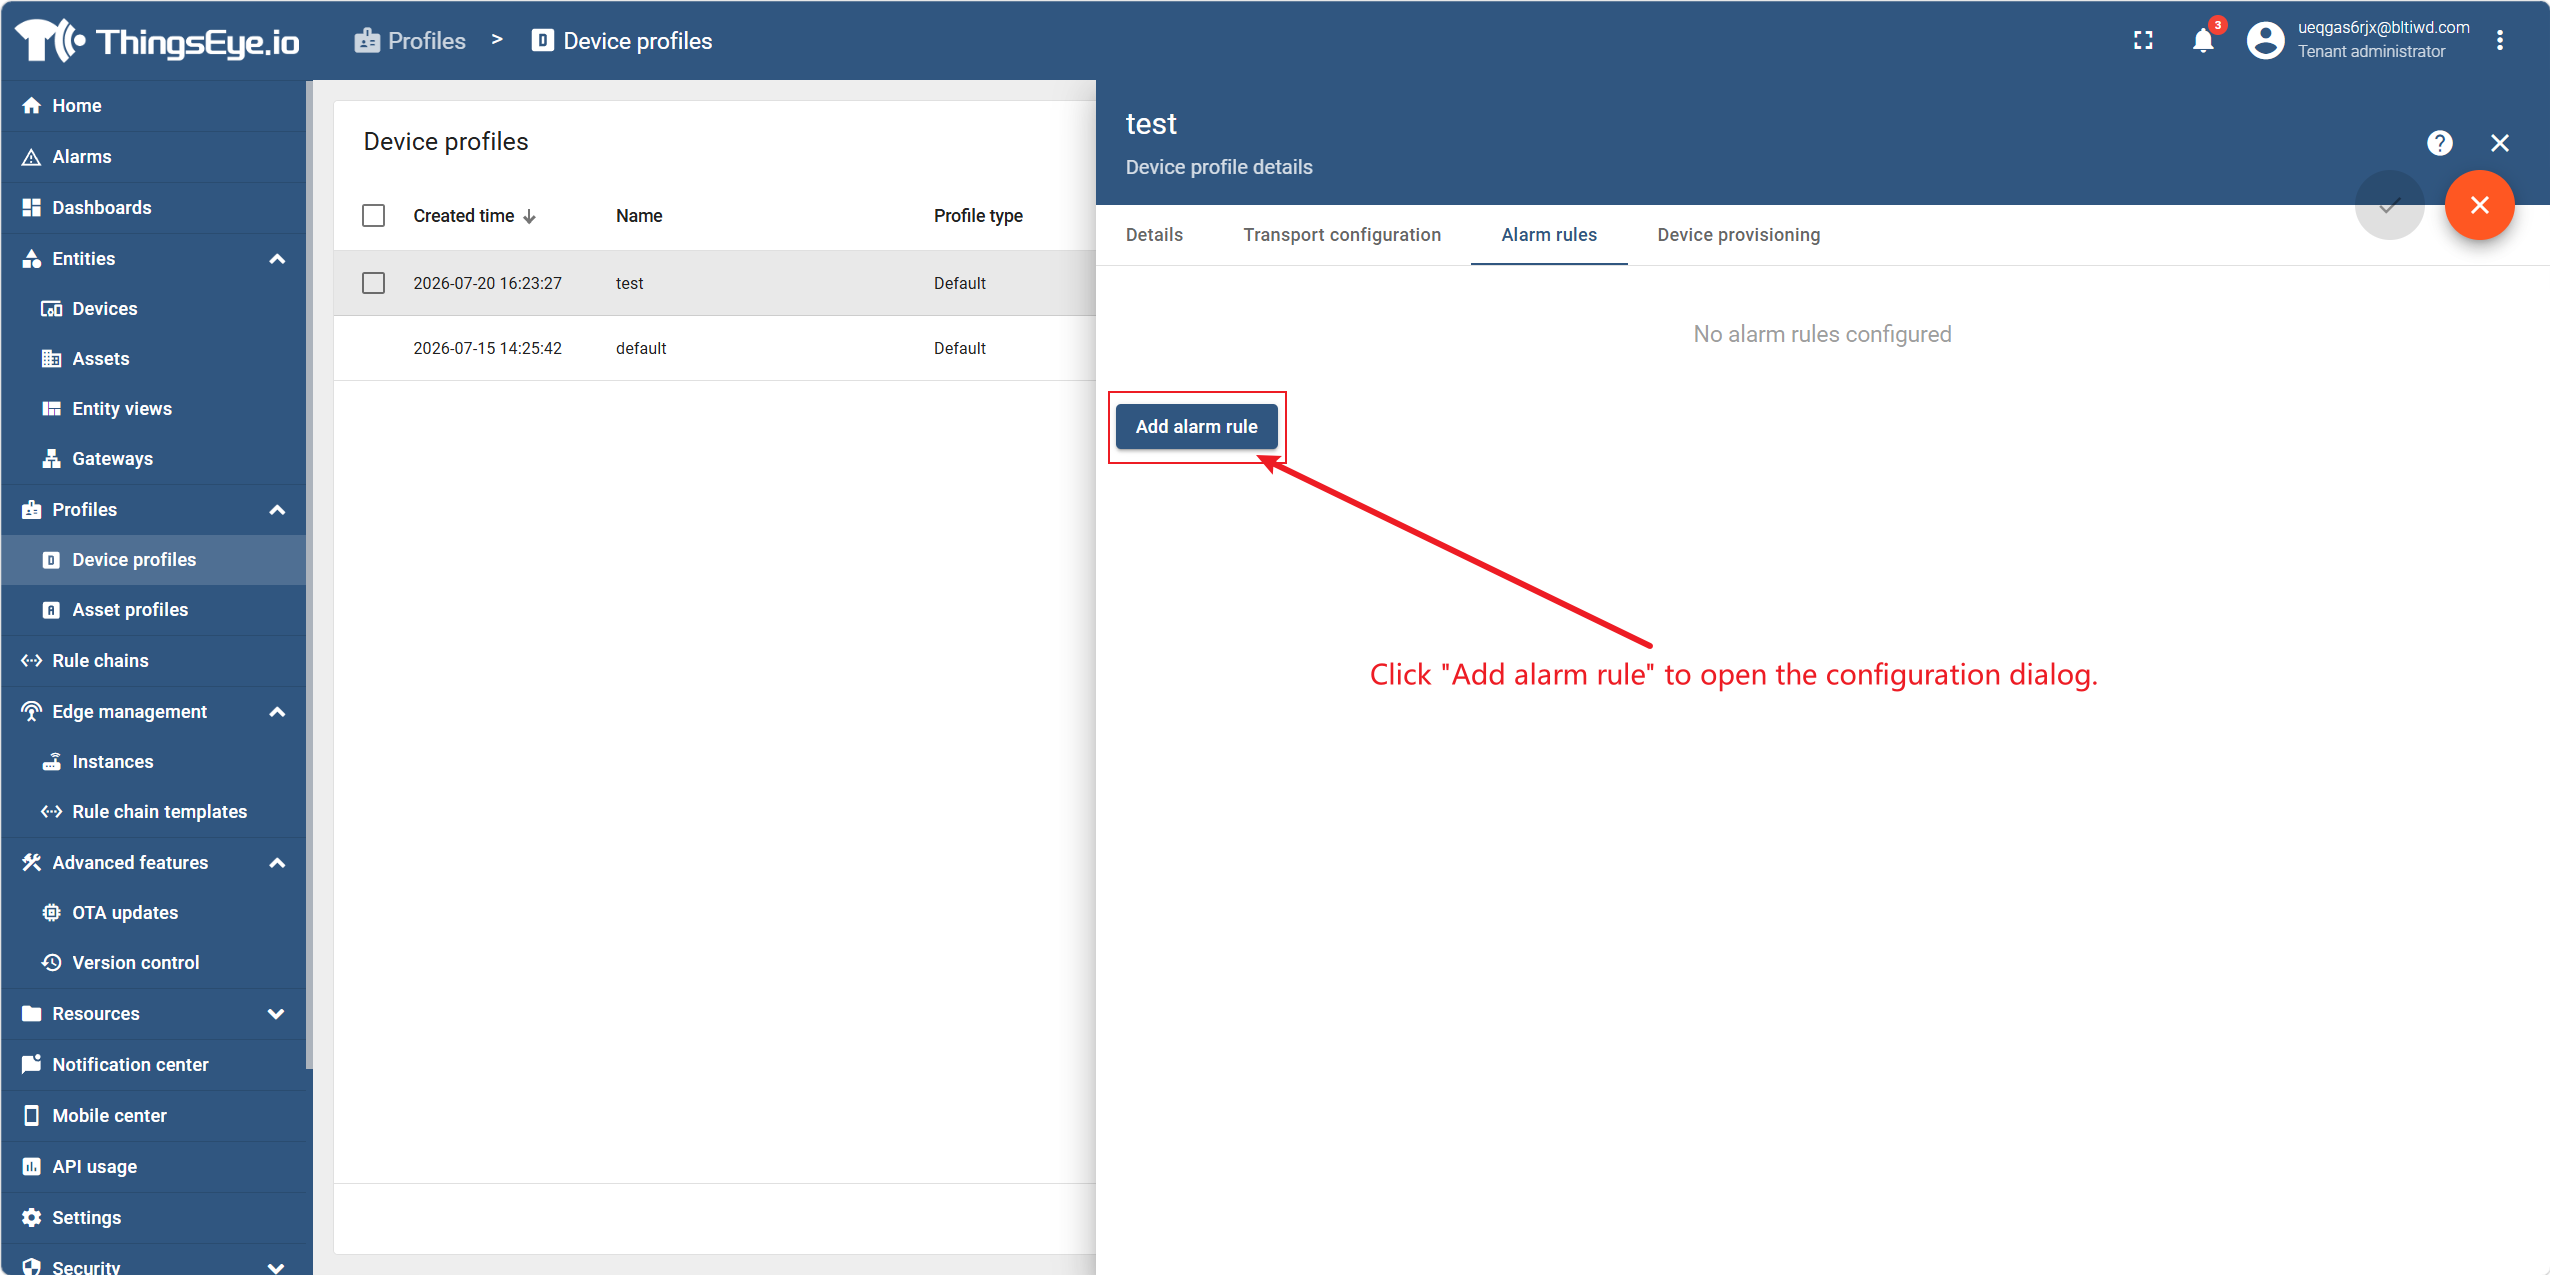
In the left menu, select "Profiles" → "Device Profiles", click the target profile name, and switch to the "Alarm Rules" tab. Click "Add Alarm Rule" to open the configuration dialog.
Step 2: Configure creation conditions
Complete the following settings in the configuration dialog:
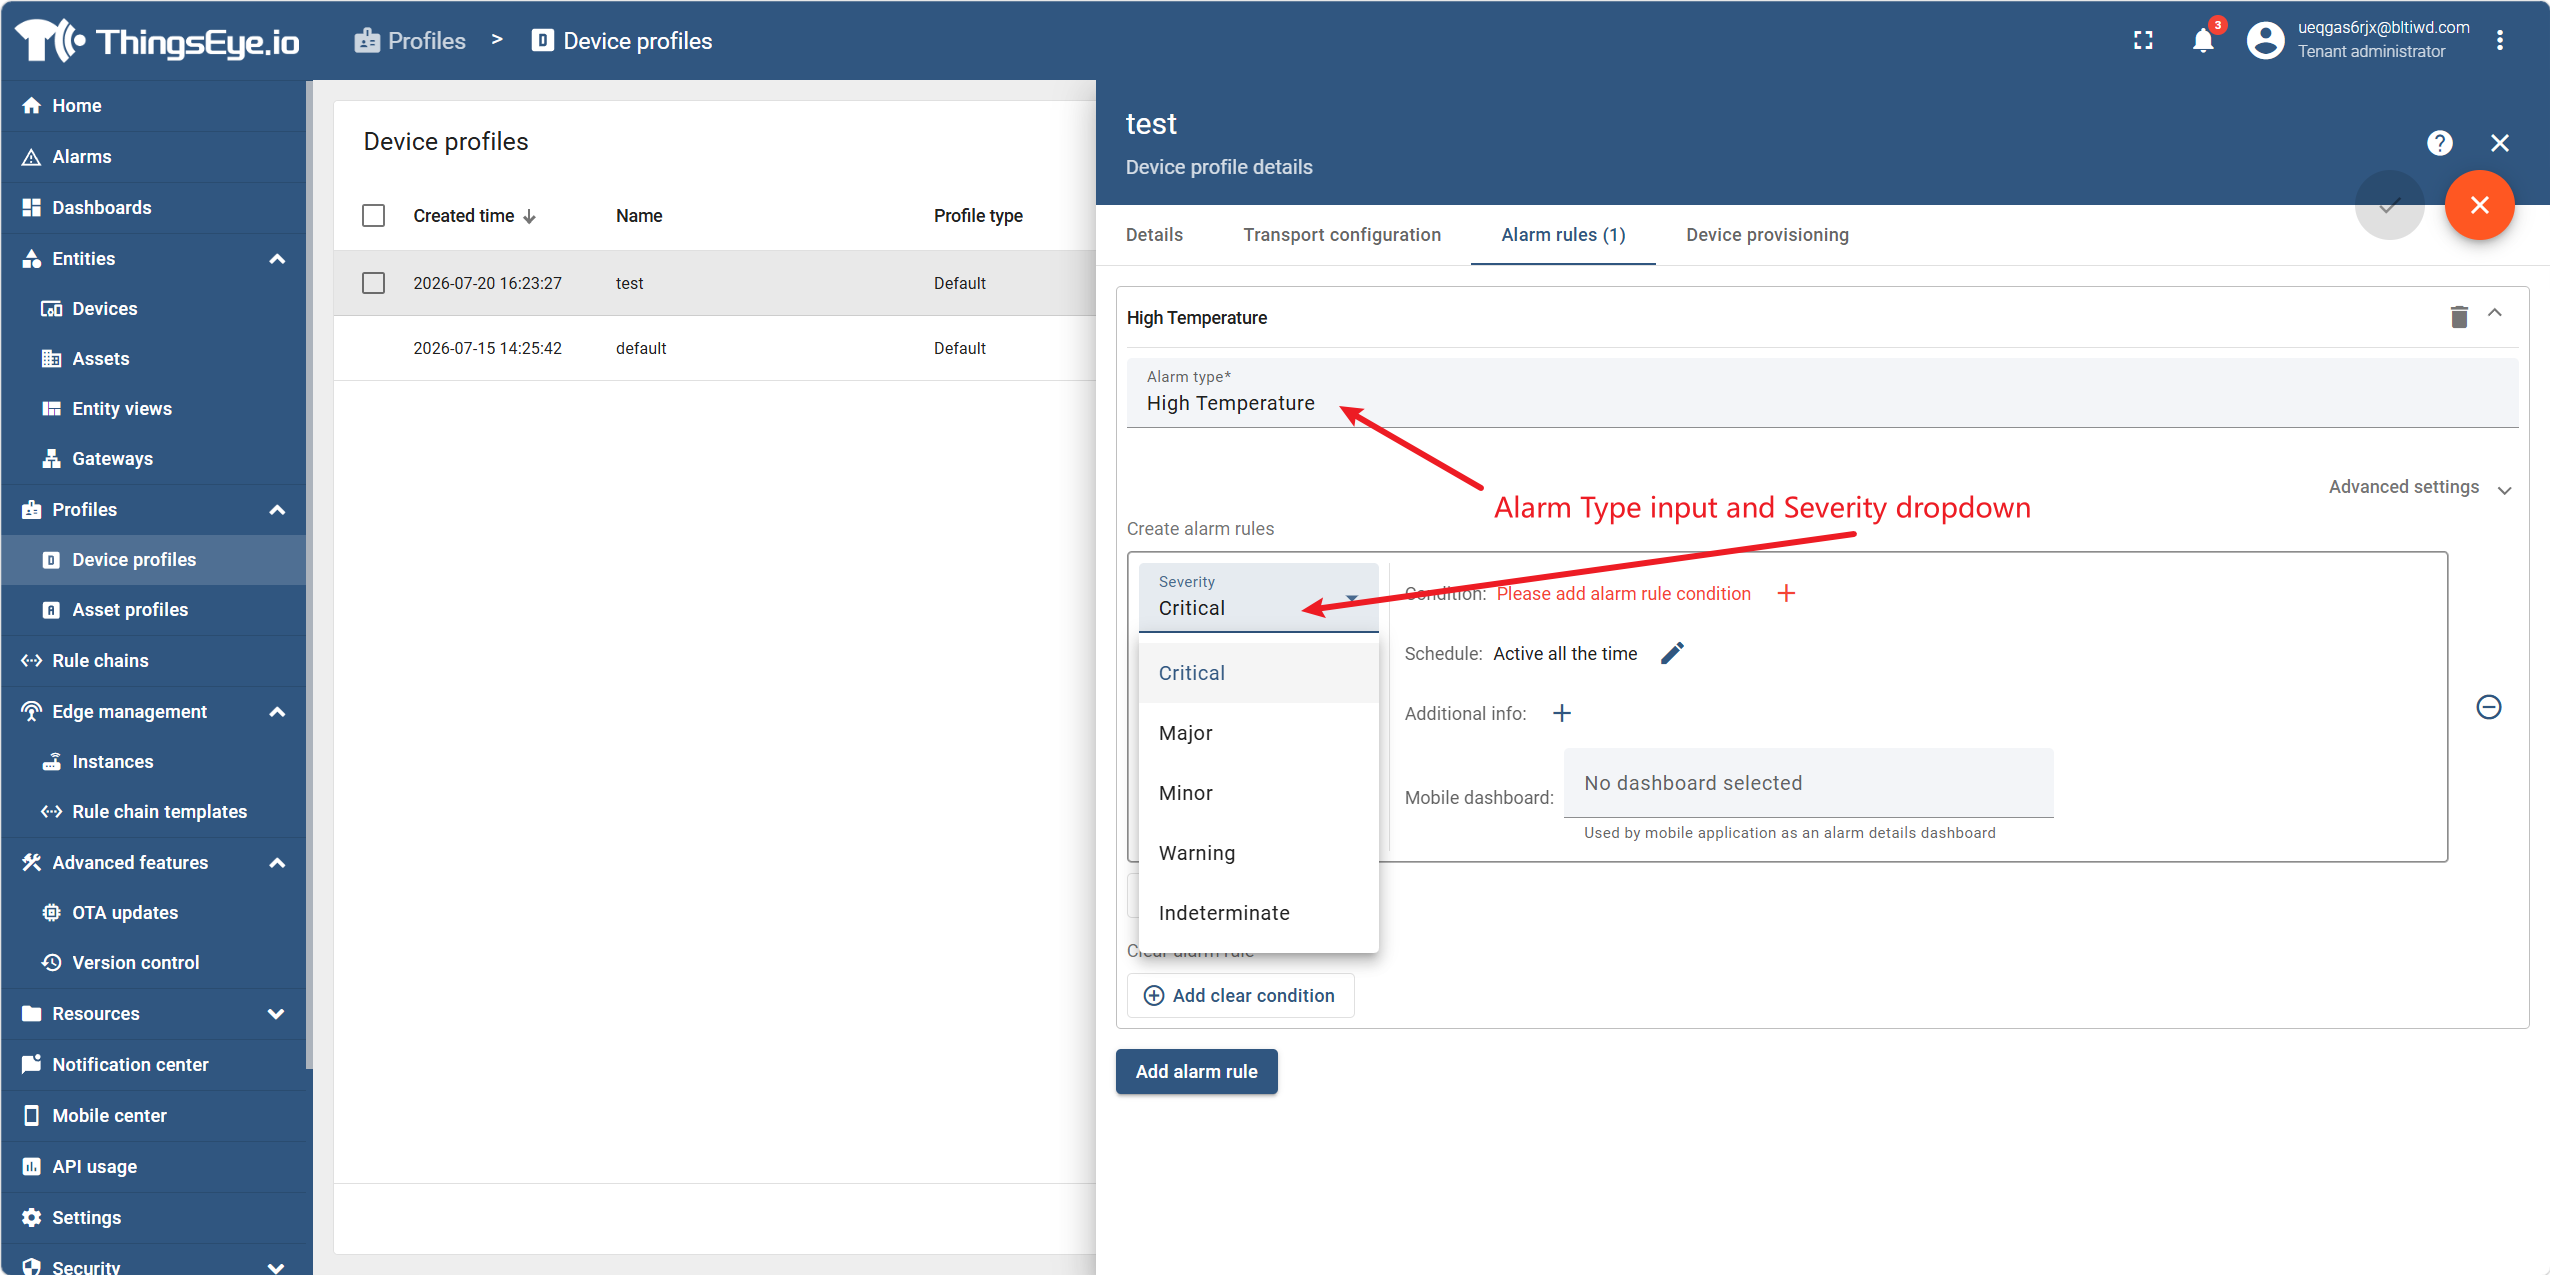
- (1) Alarm type and severity level: Enter the alarm type name (e.g., "High Temperature") and select the corresponding severity level.
Behavior Note: ThingsEye evaluates conditions in descending order of severity. If a condition with a certain severity evaluates to true, only one alarm of that severity is generated; no lower‑severity alarm will be created additionally. Different conditions within the same rule must have different severity levels.
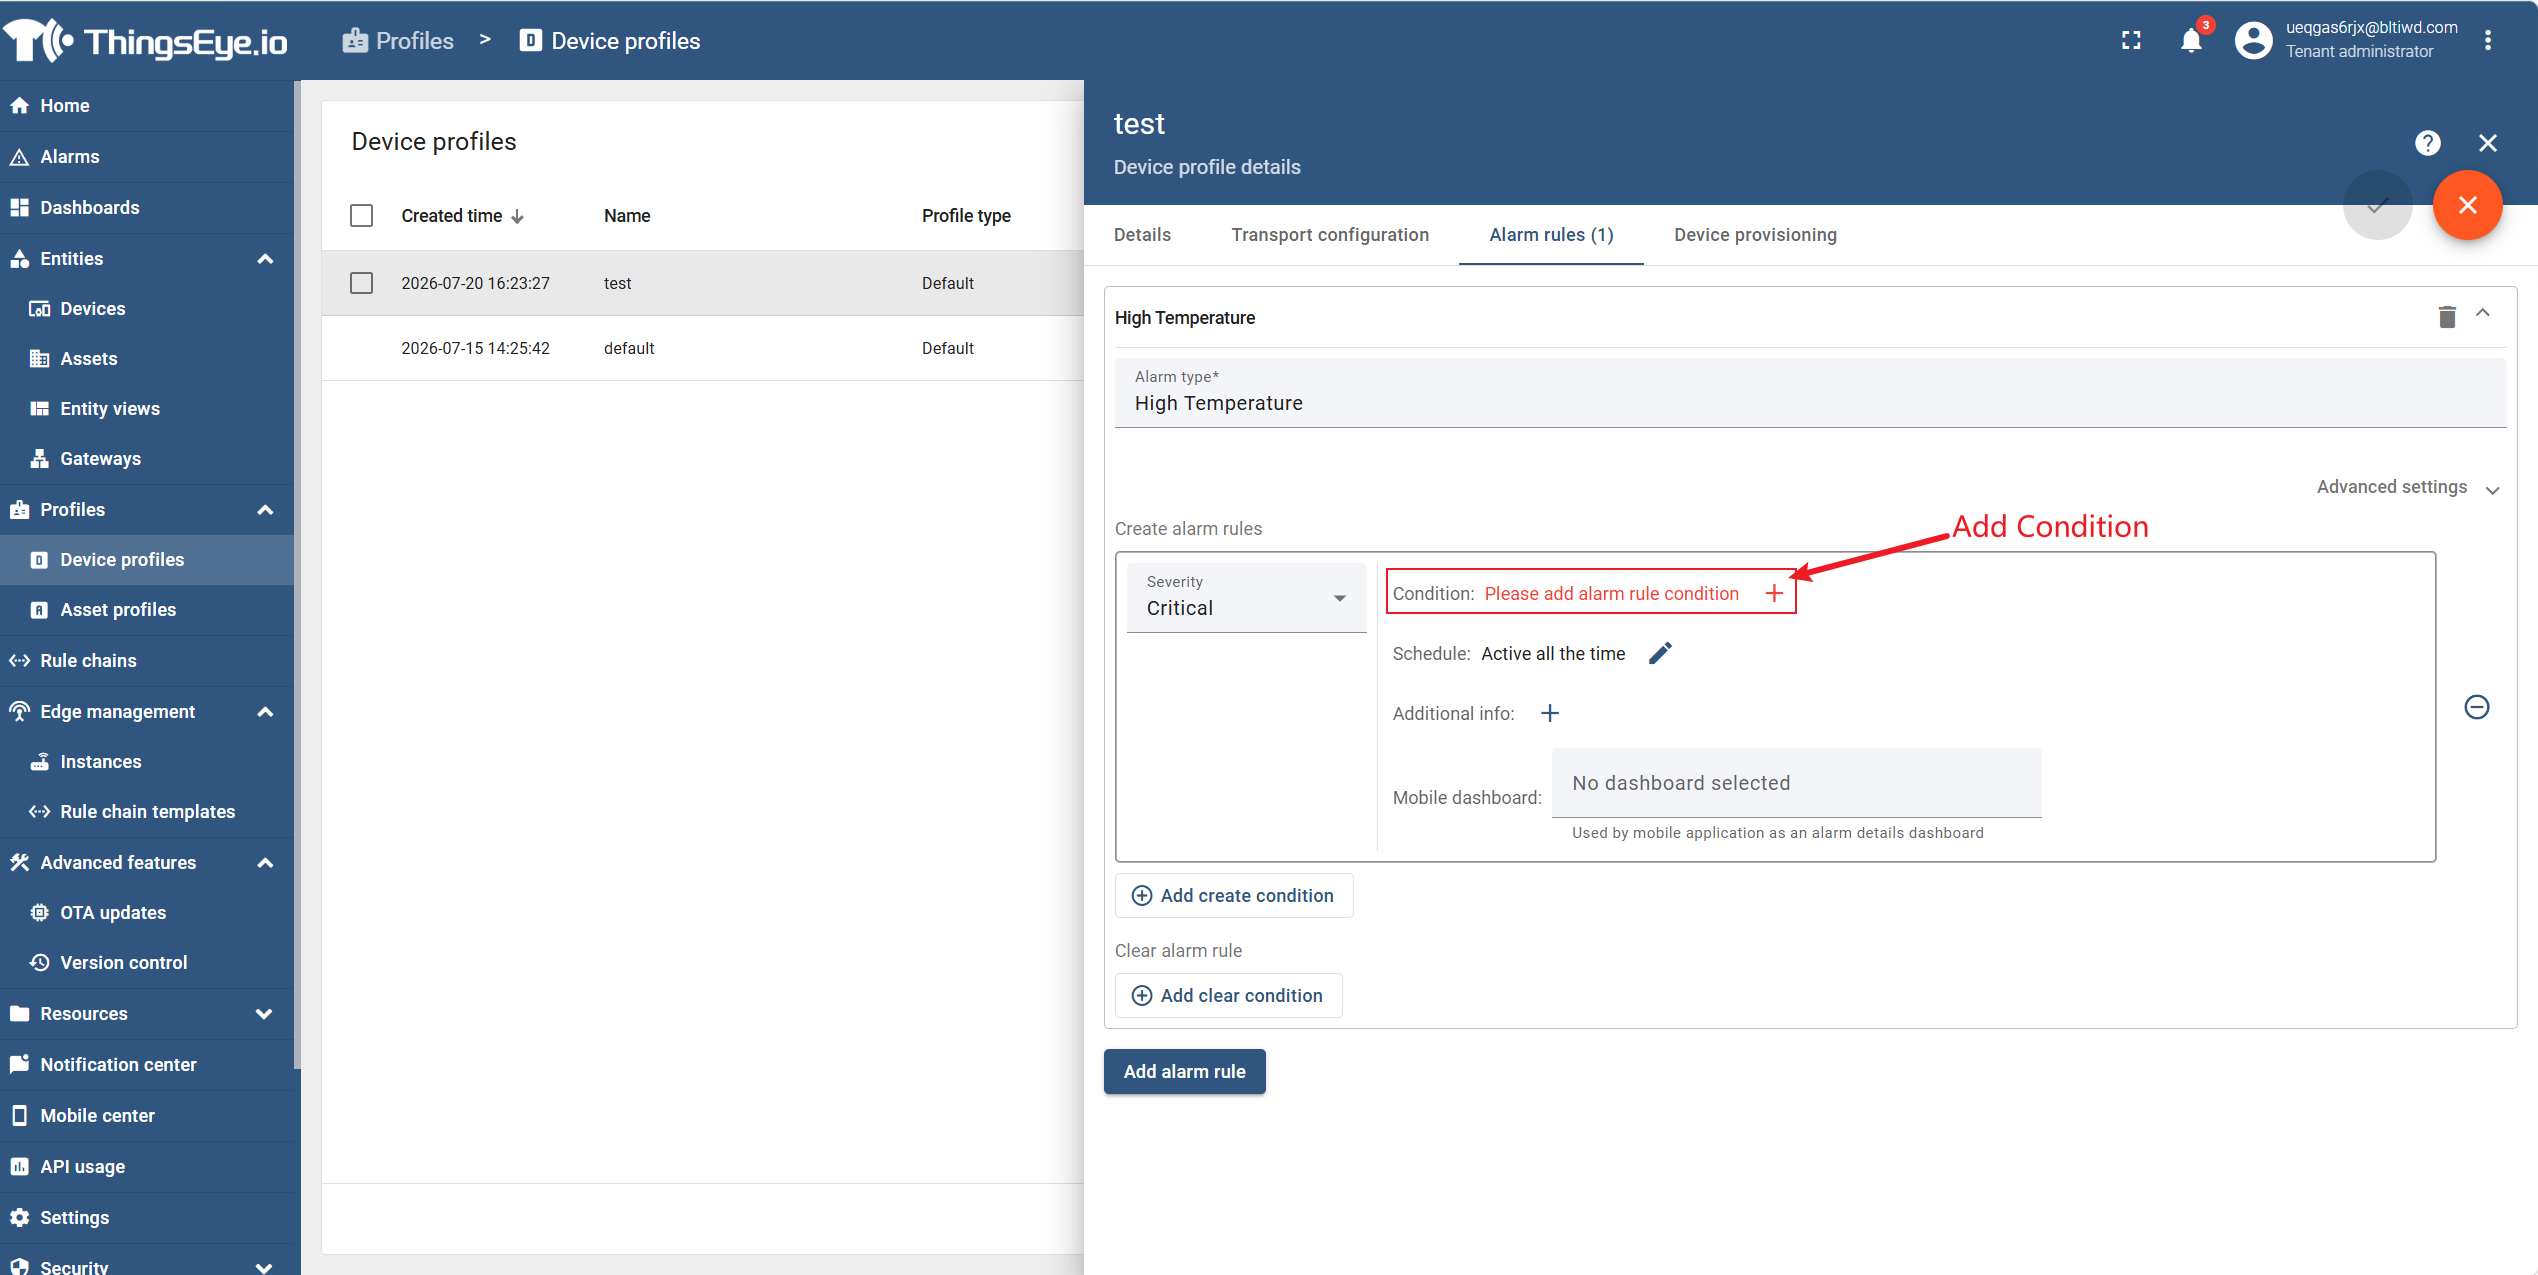
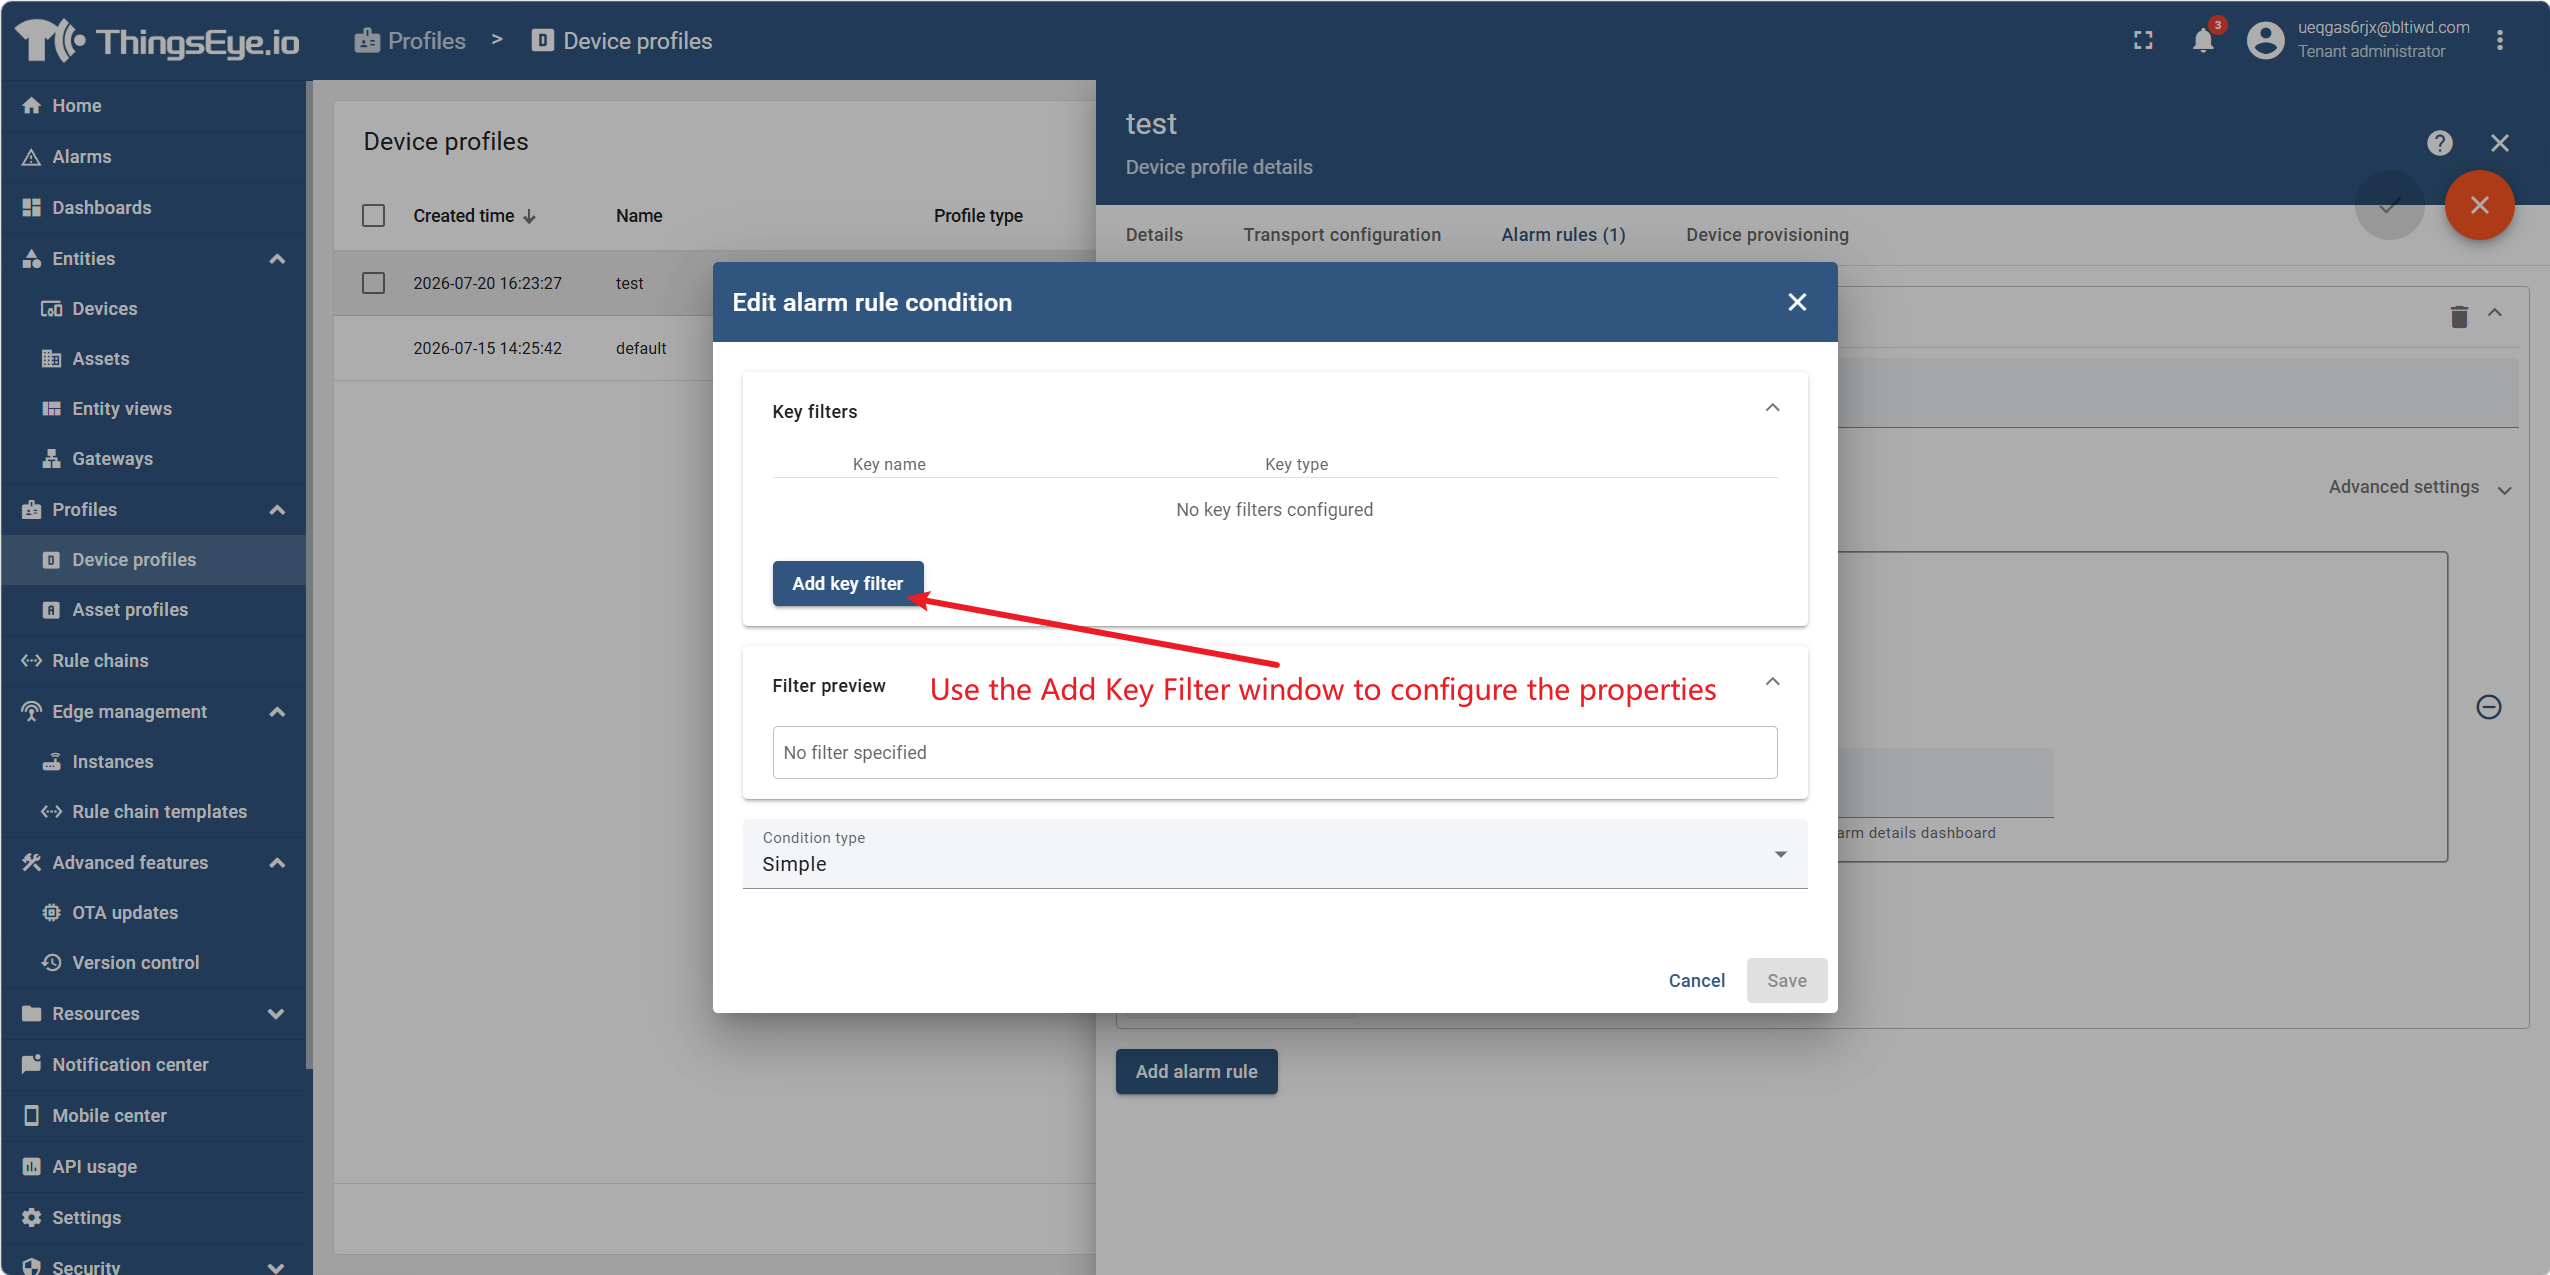
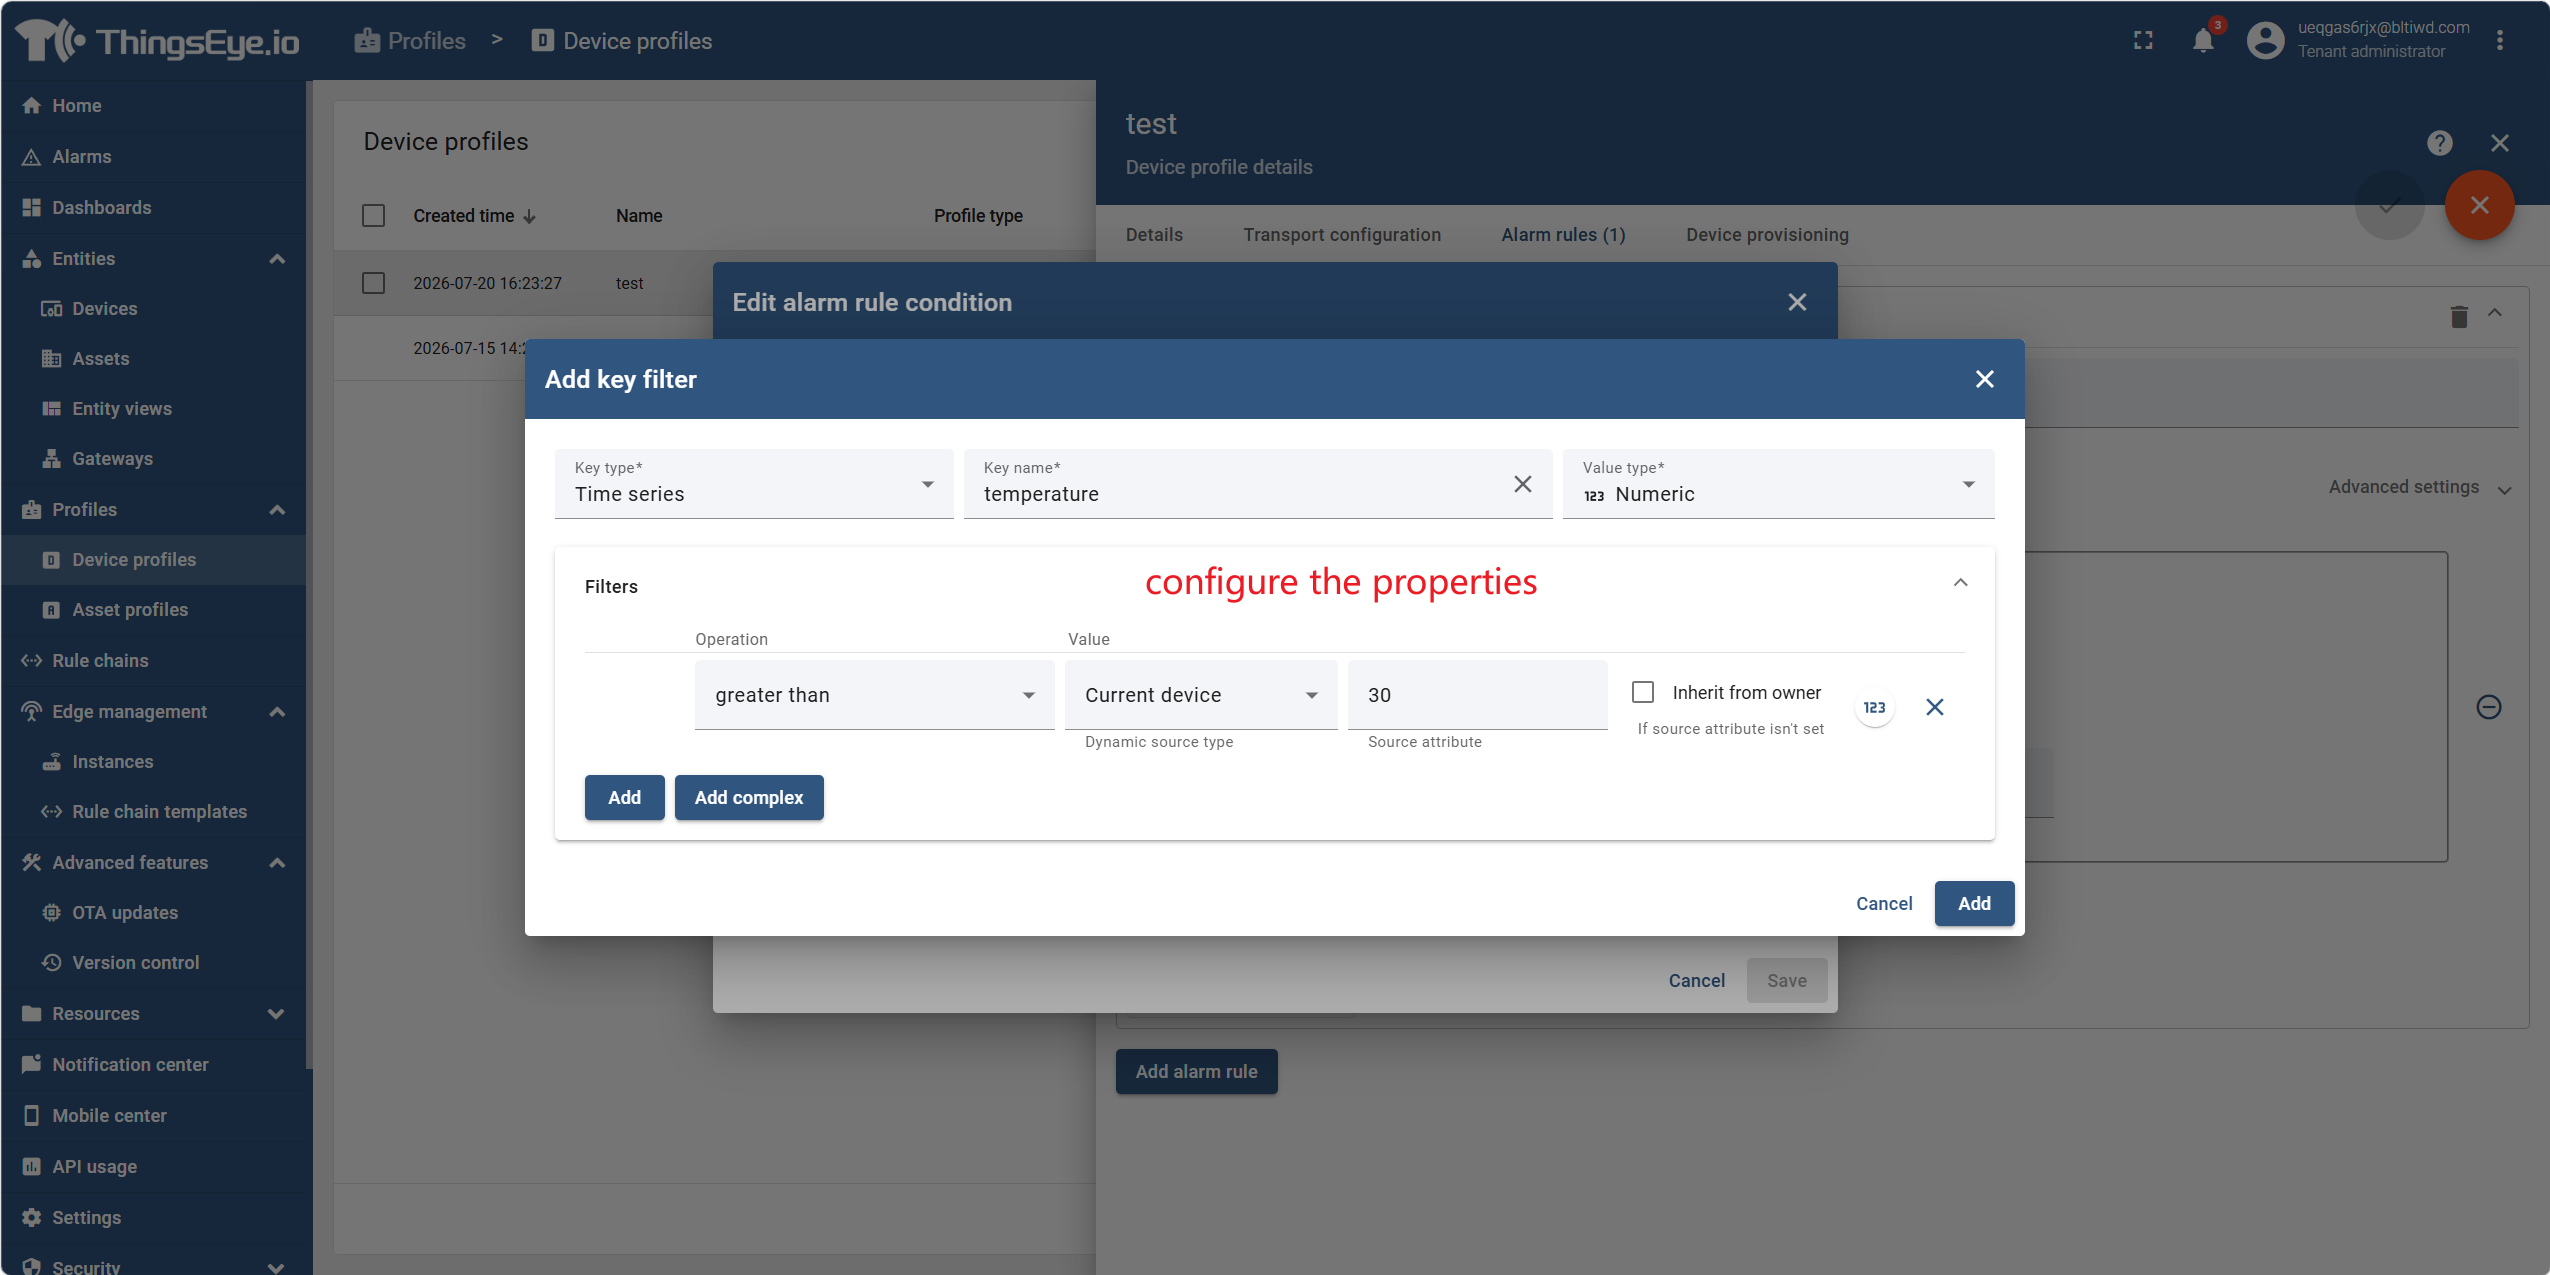
- (2) Condition expression: Click "Add Condition" → "Add Filter Condition" to configure the triggering evaluation logic:
- Multiple filter conditions can be combined using AND/OR. After completion, click "Add".
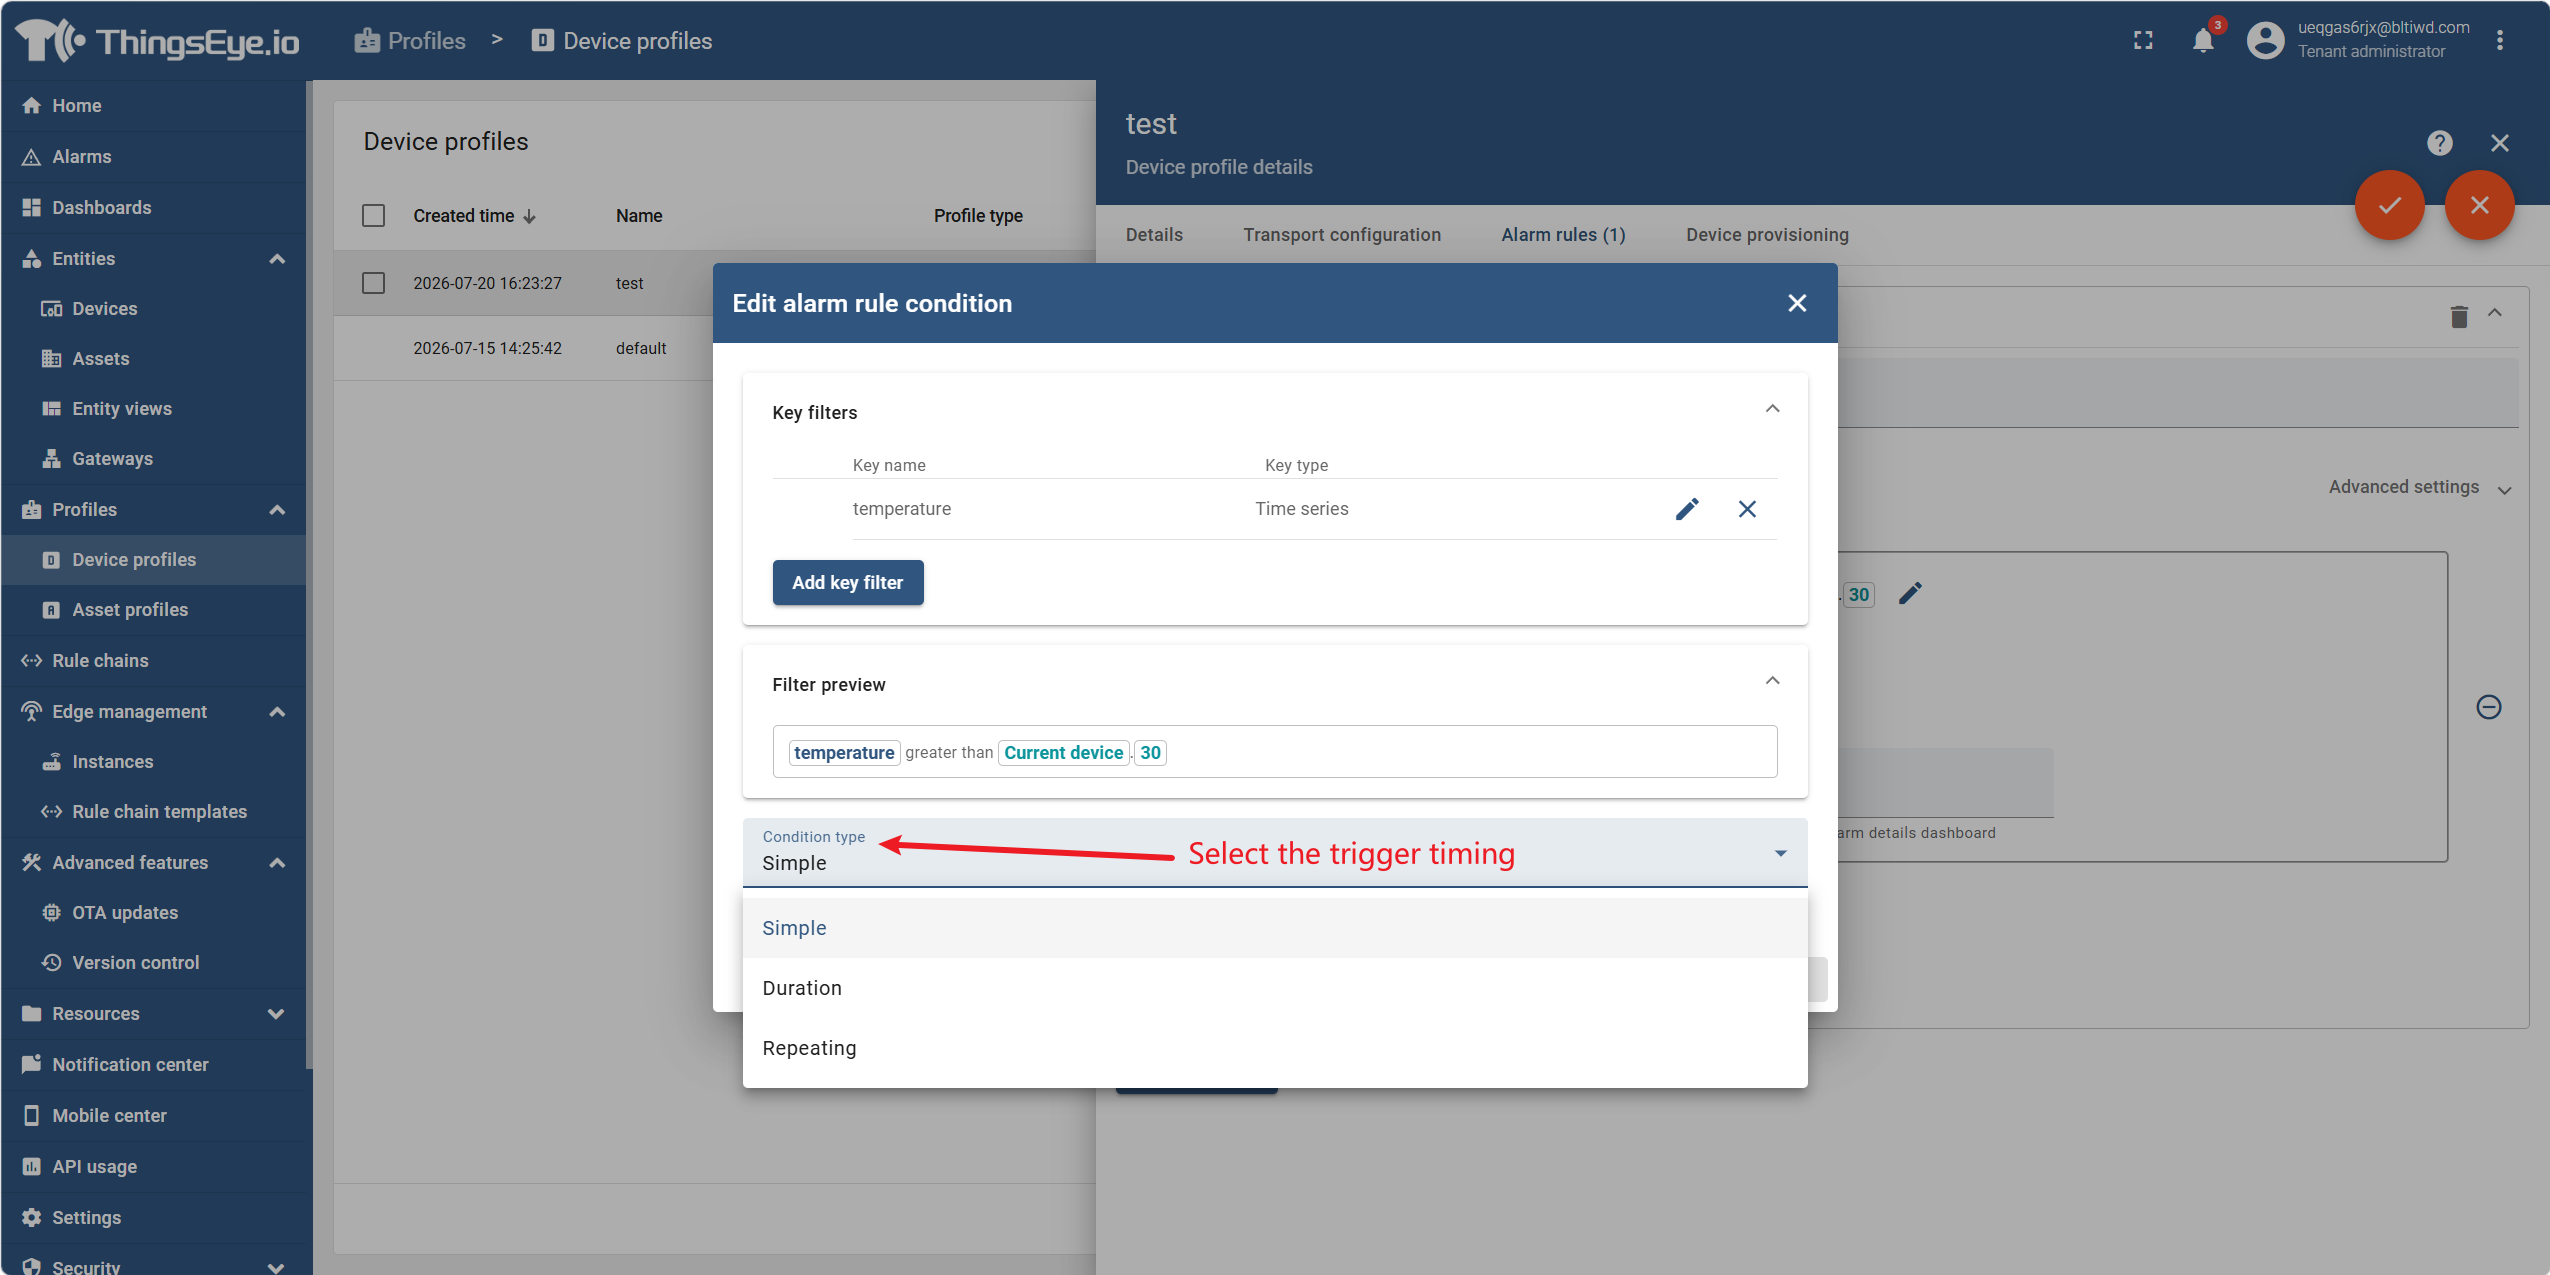
- (3) Condition type: Select the trigger timing:
- After selection, configure the corresponding duration value or number of event occurrences.
| Type | Behavior | Use Case |
|---|---|---|
| Simple | Triggers immediately when the condition is true | Real‑time threshold detection |
| Duration | Triggers after the condition remains true for a specified duration | Filtering short‑term spikes |
| Repeated | Triggers after the condition evaluates to true for a specified number of consecutive times | Detecting repeated continuous anomalies |
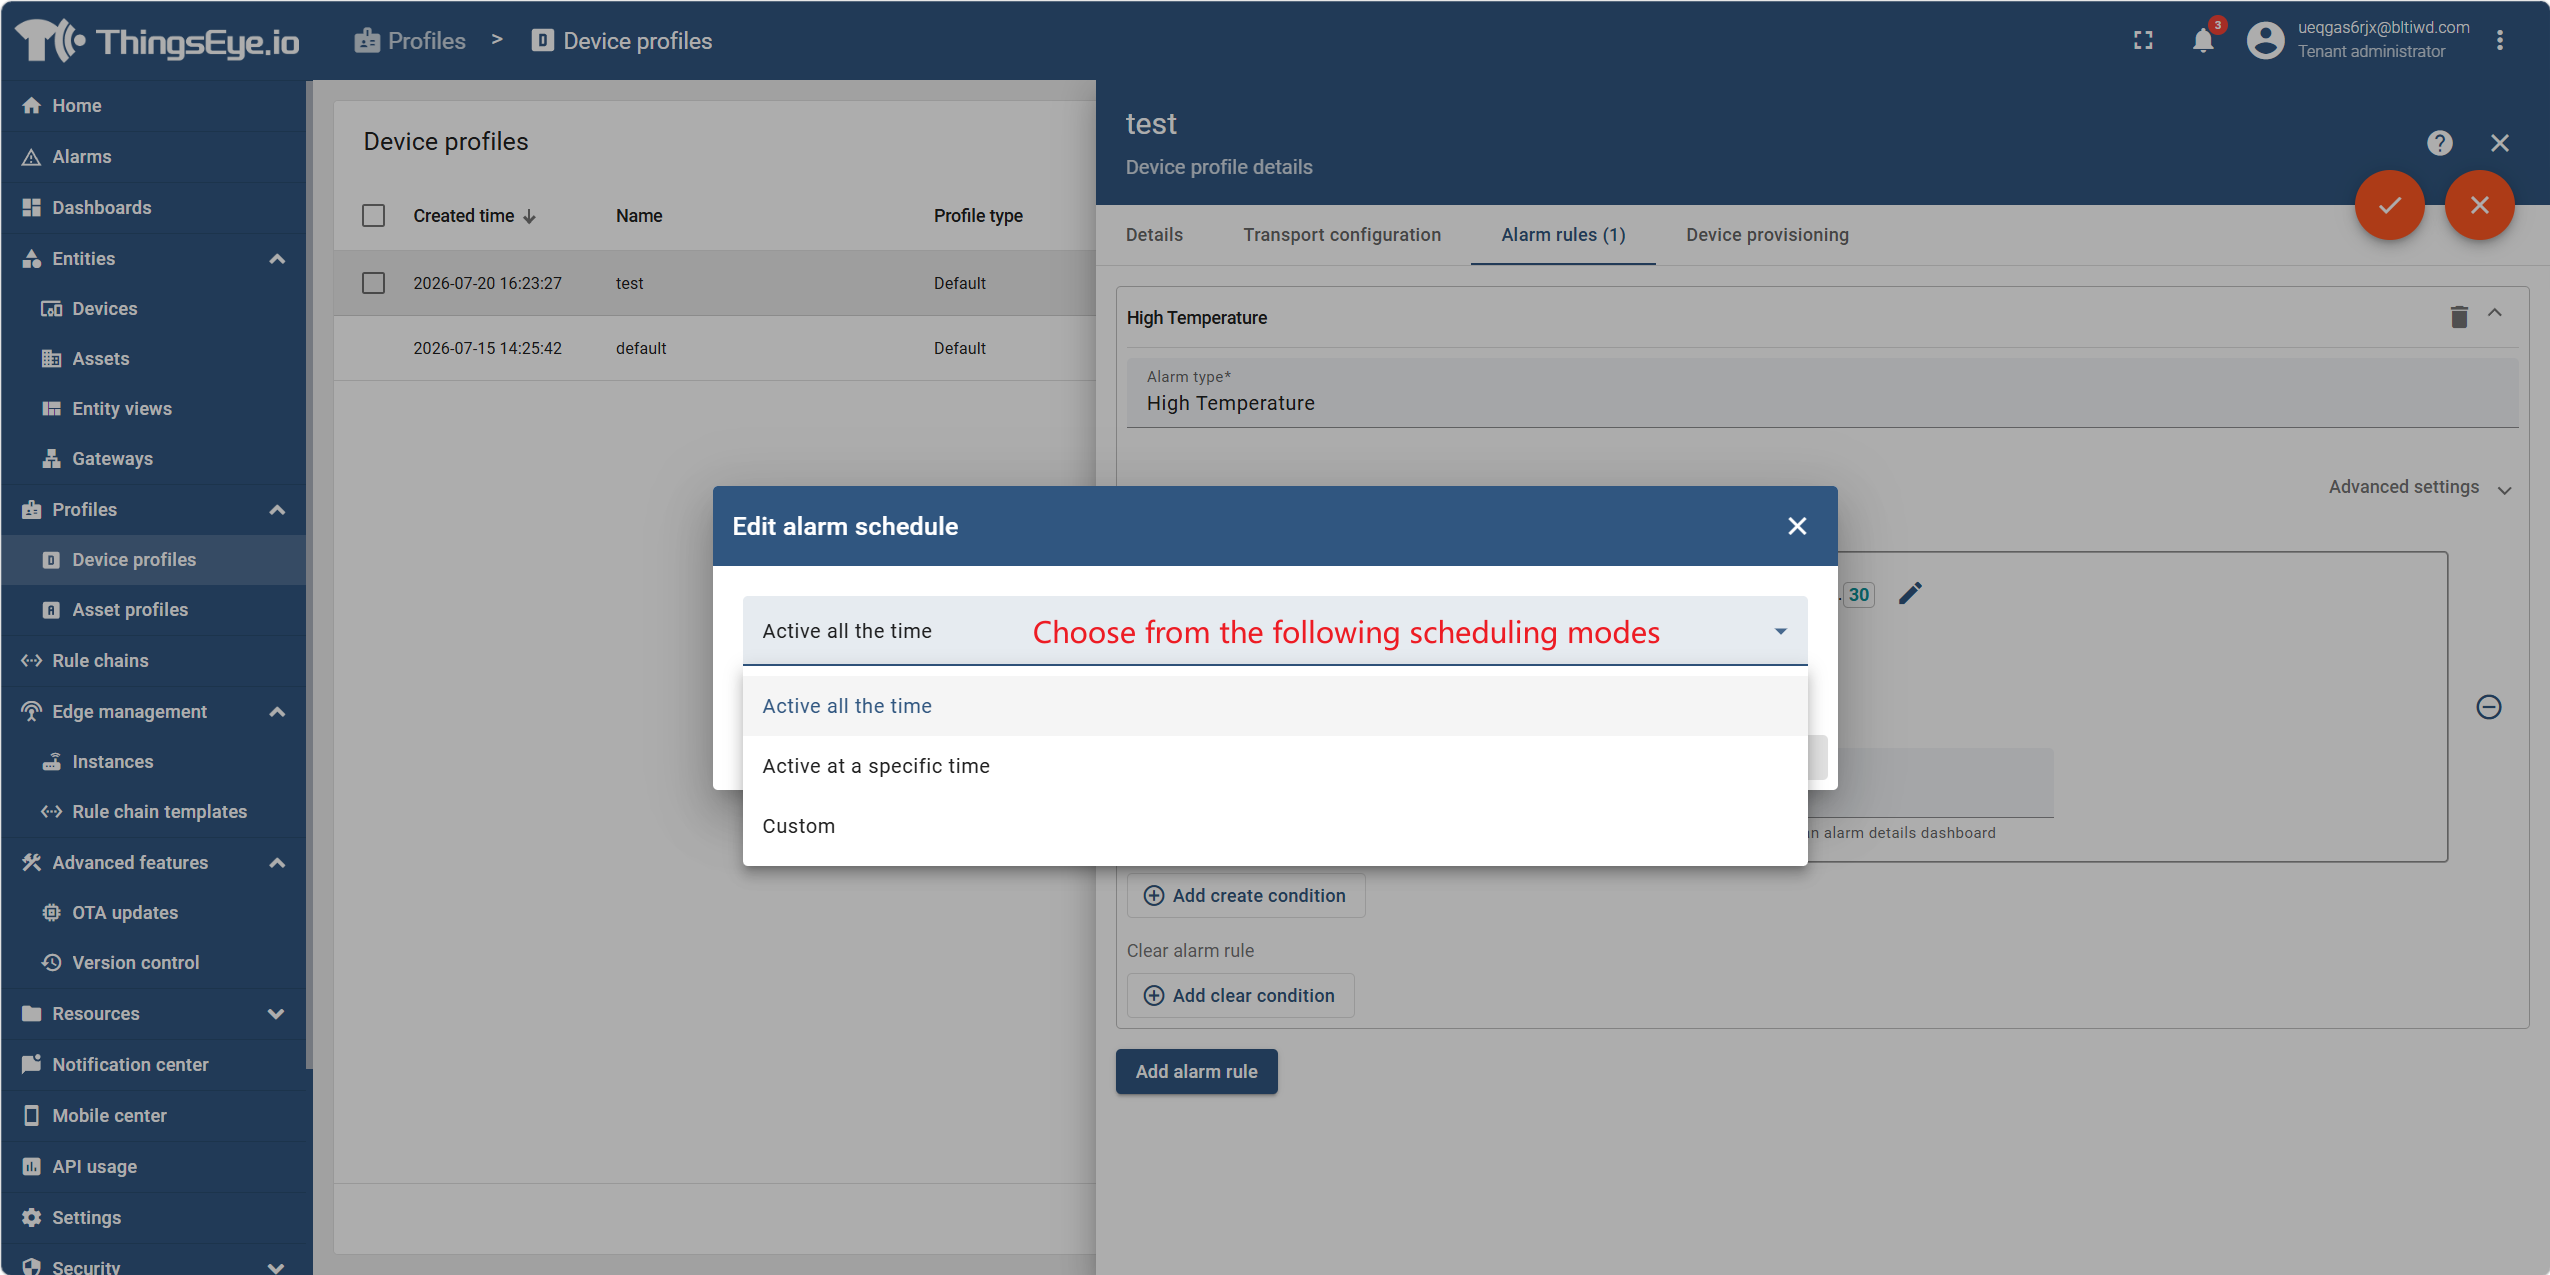
- (4) Time schedule: Select "Always Active", "Active at Specified Times" (set weekly active periods), or "Custom".
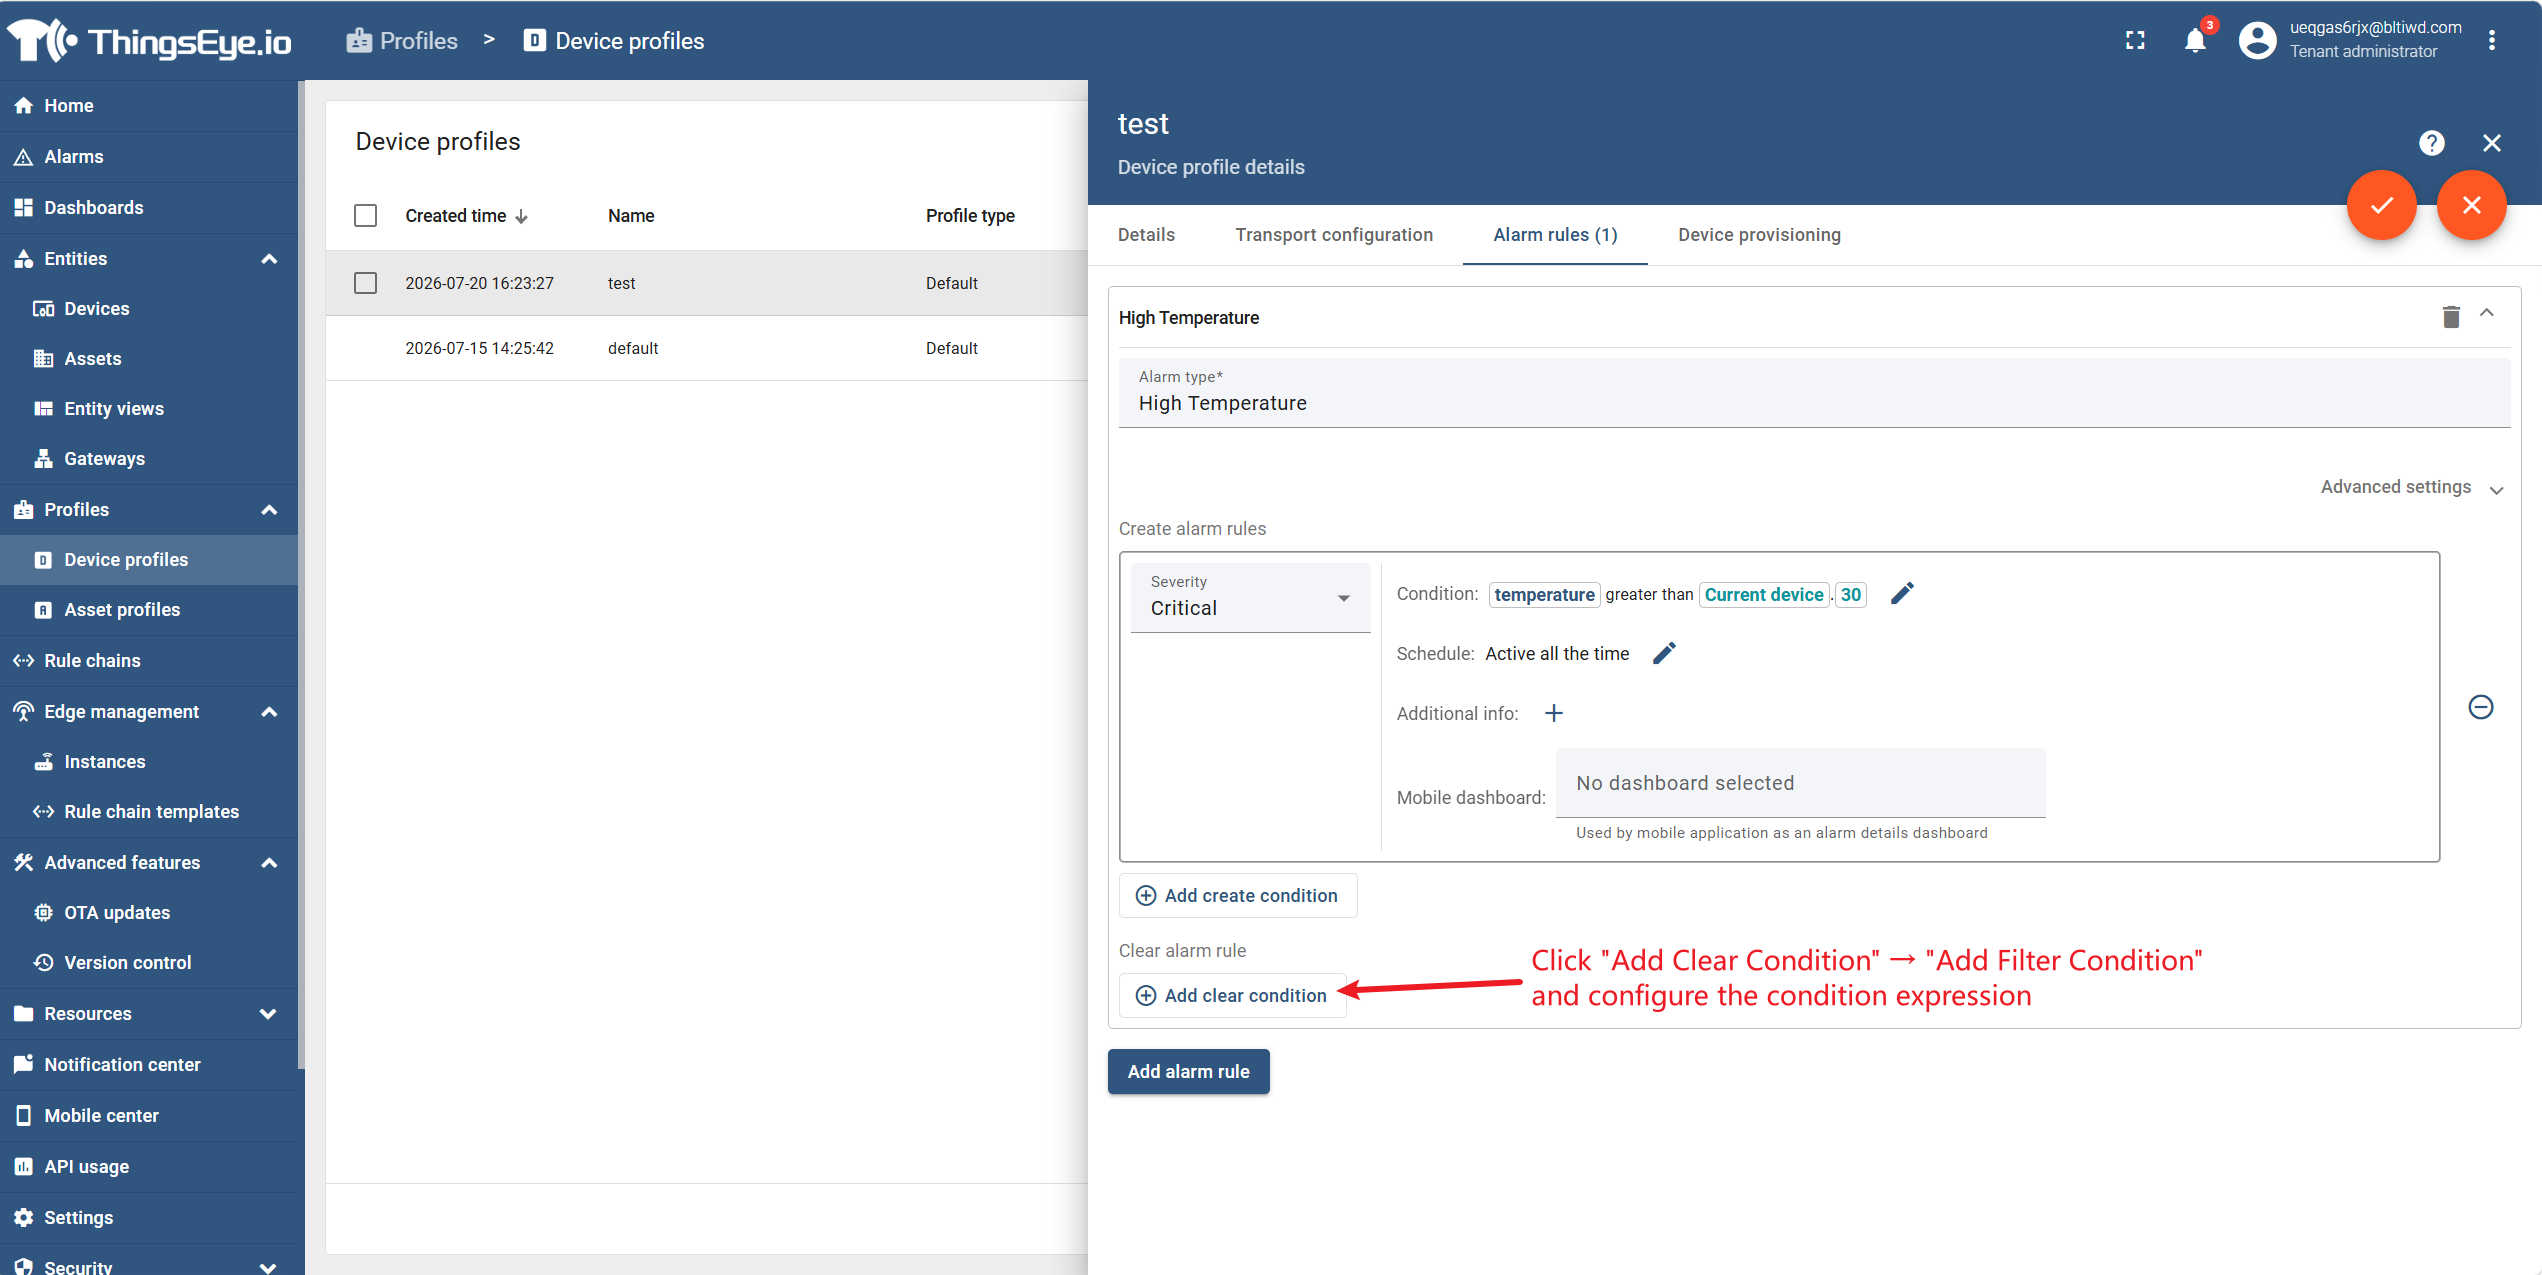
Step 3: Configure clearing conditions (optional)
Click "Add Clearing Condition" → "Add Filter Condition" and configure the condition expression (configuration method is the same as Step 2). When the condition is met, the alarm will be automatically cleared.
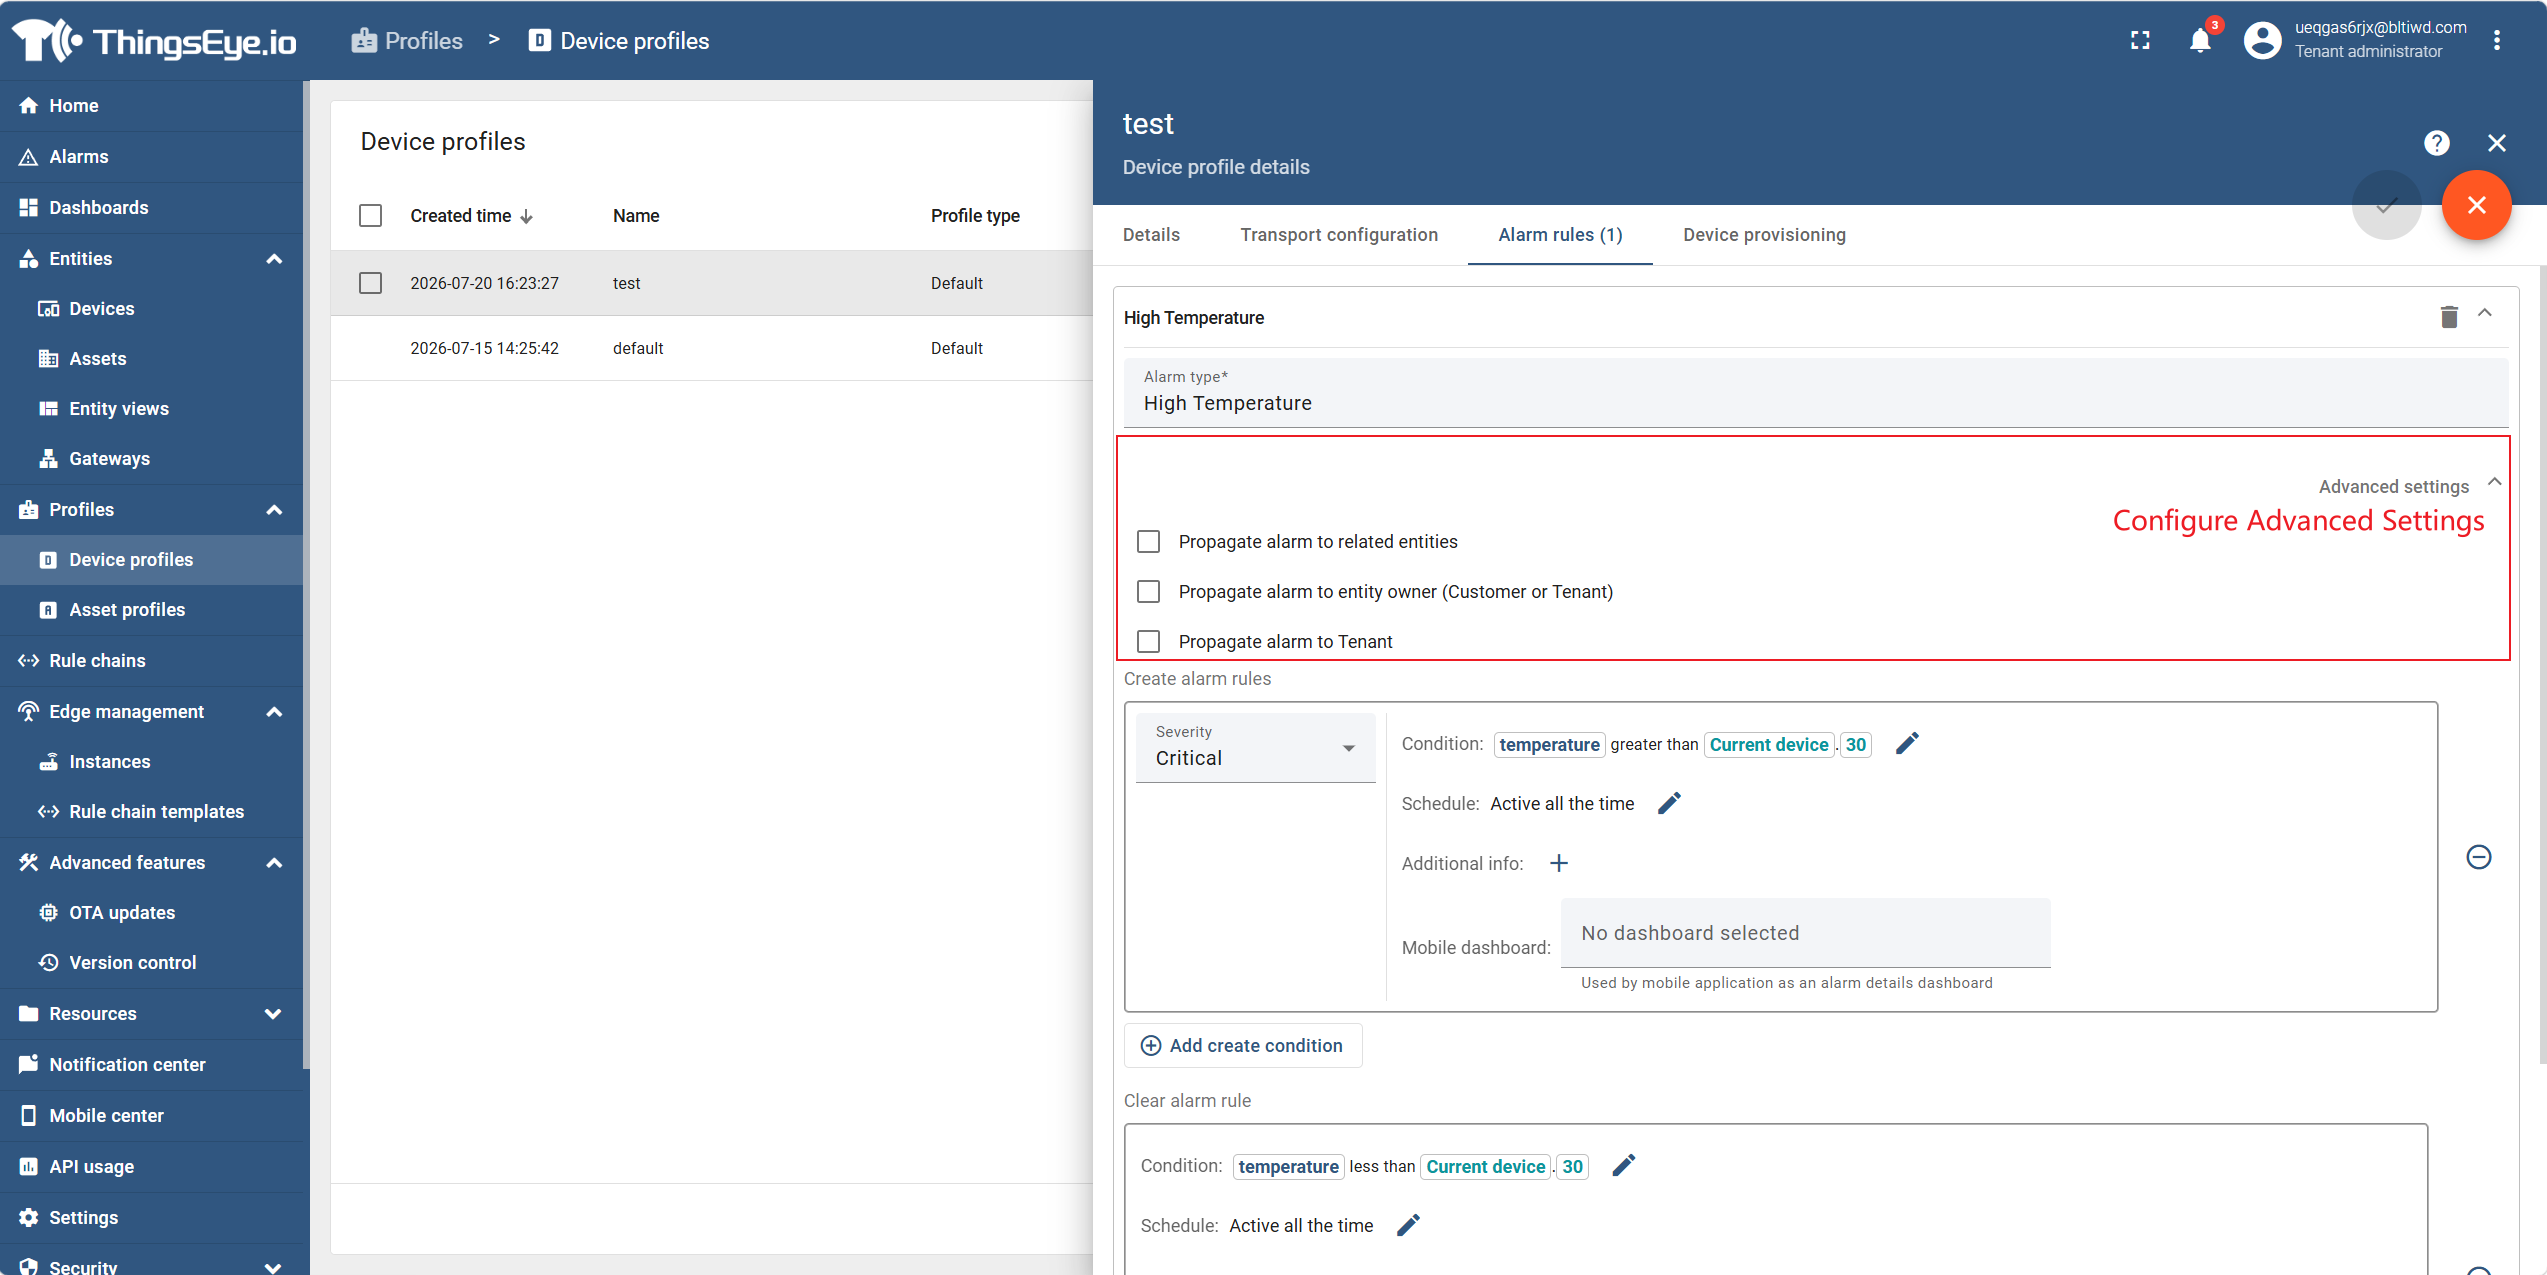
Step 4: Configure advanced settings (optional)
In "Advanced Settings", configure alarm propagation:
| Option | Description |
|---|---|
| Propagate Alarm | When enabled, the alarm is propagated to related entities associated with the source entity |
| Propagate to Owner (Customer/Tenant) | The alarm is visible only to the direct owner (Customer or Tenant) |
| Propagate to Tenant | The alarm is visible at the tenant level; Tenant Administrators can view the alarm status of the entire infrastructure |
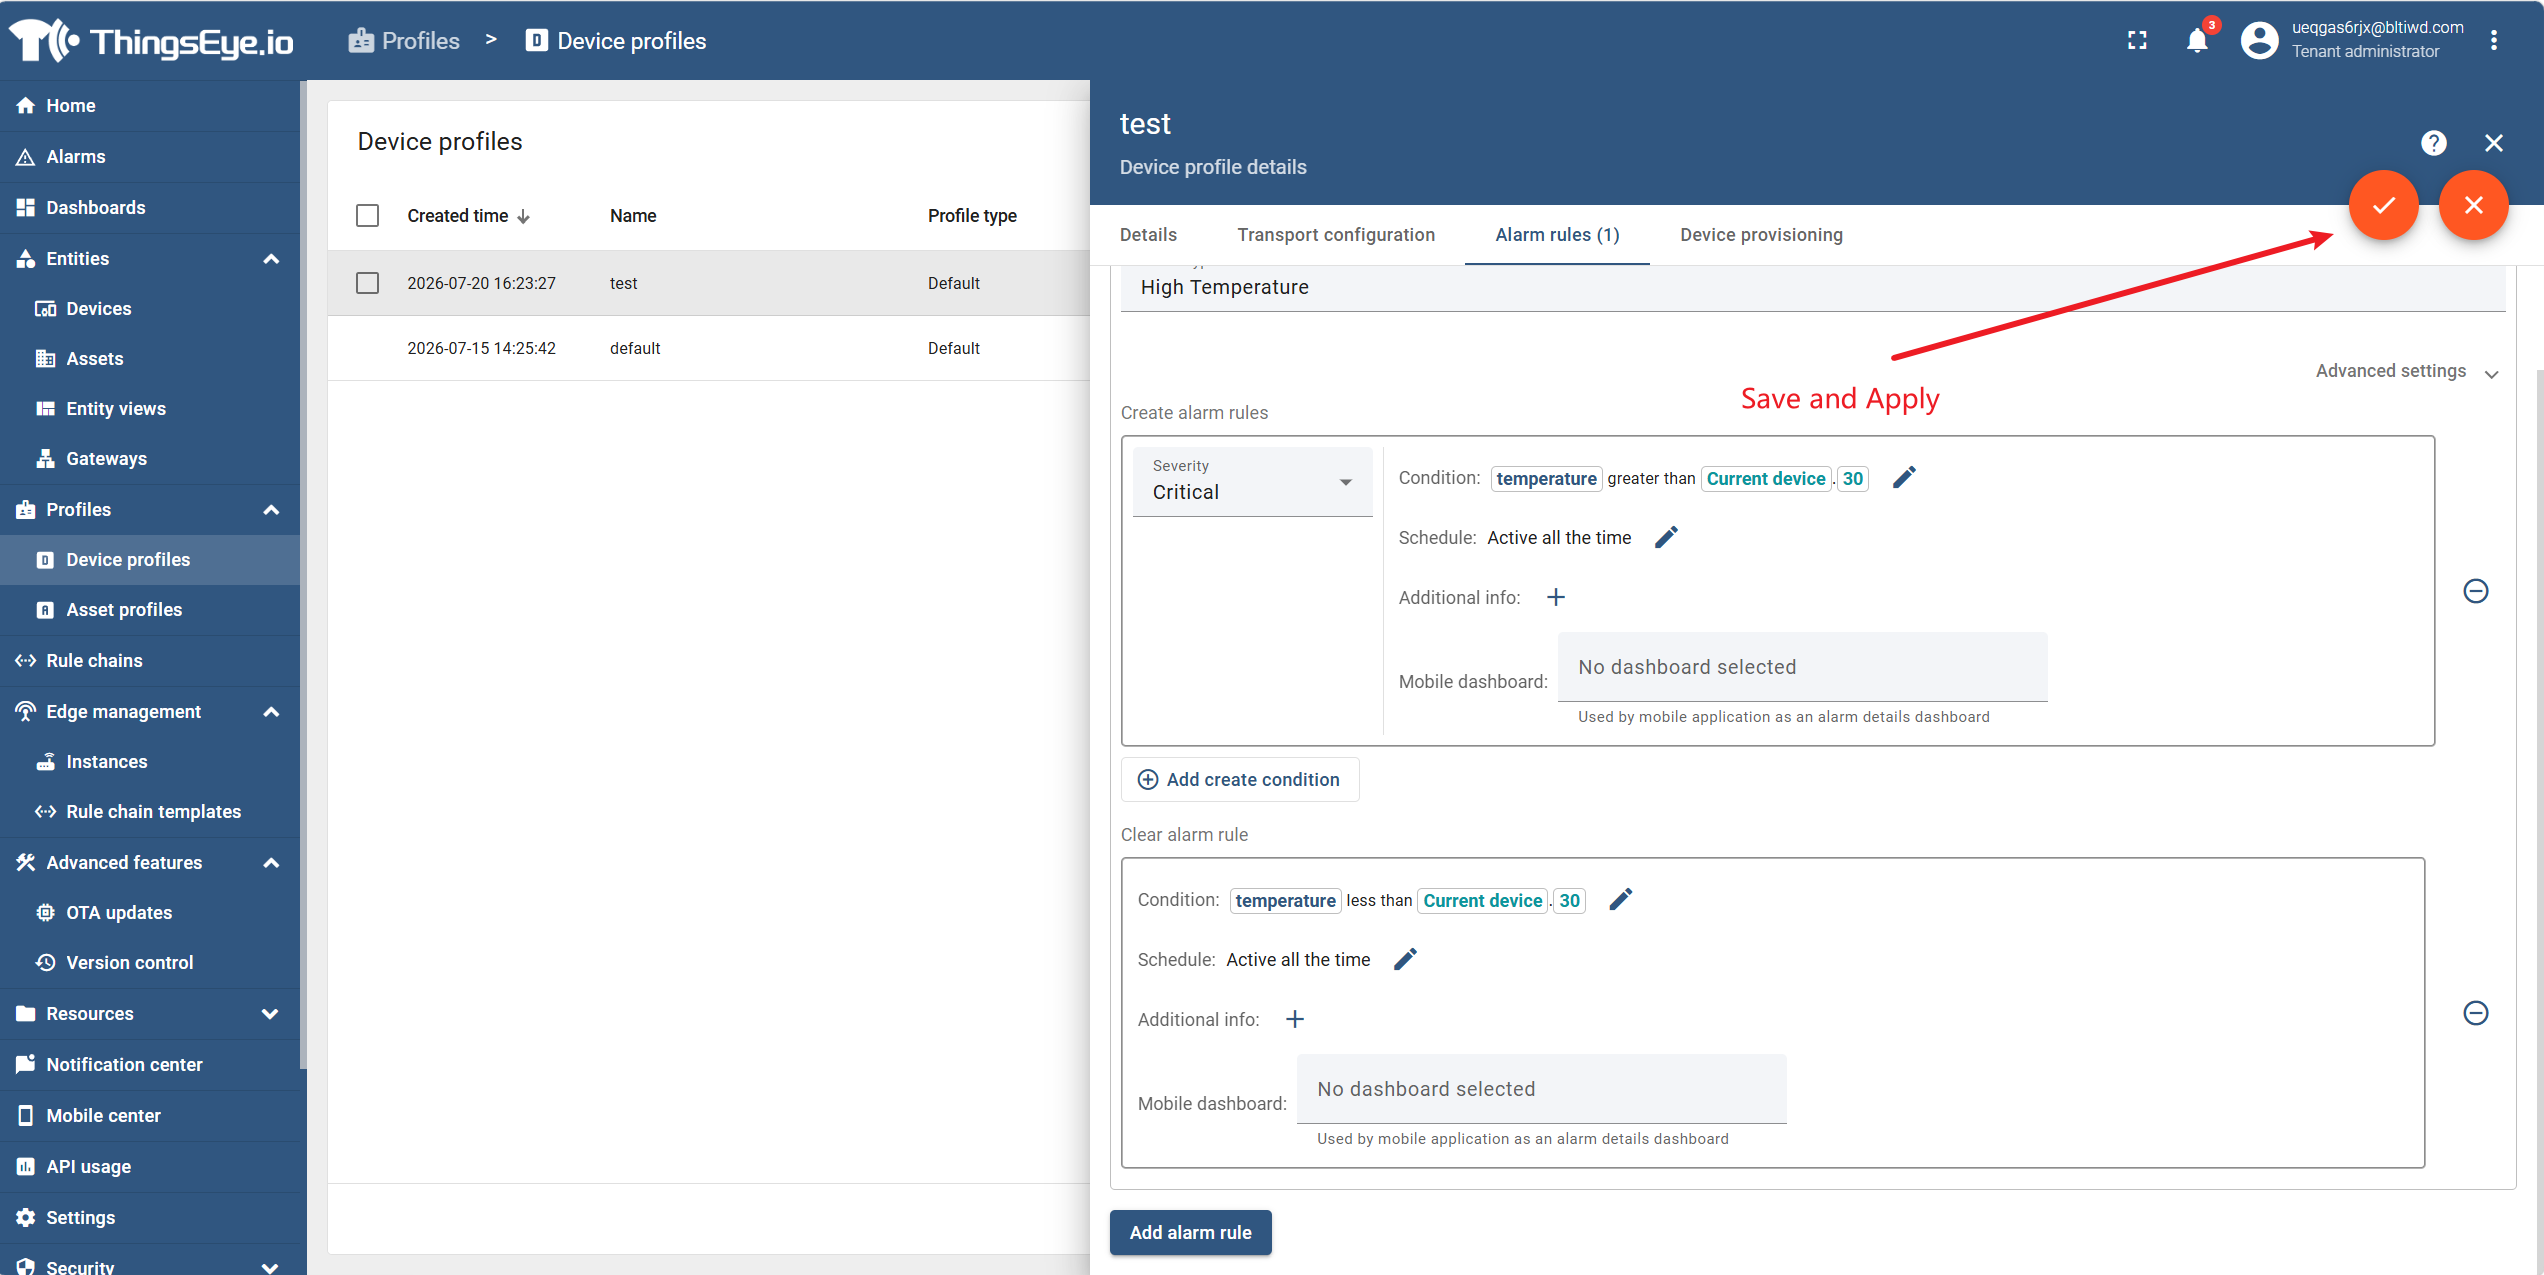
Step 5: Save and apply
2. View and Process Alarms
Procedure
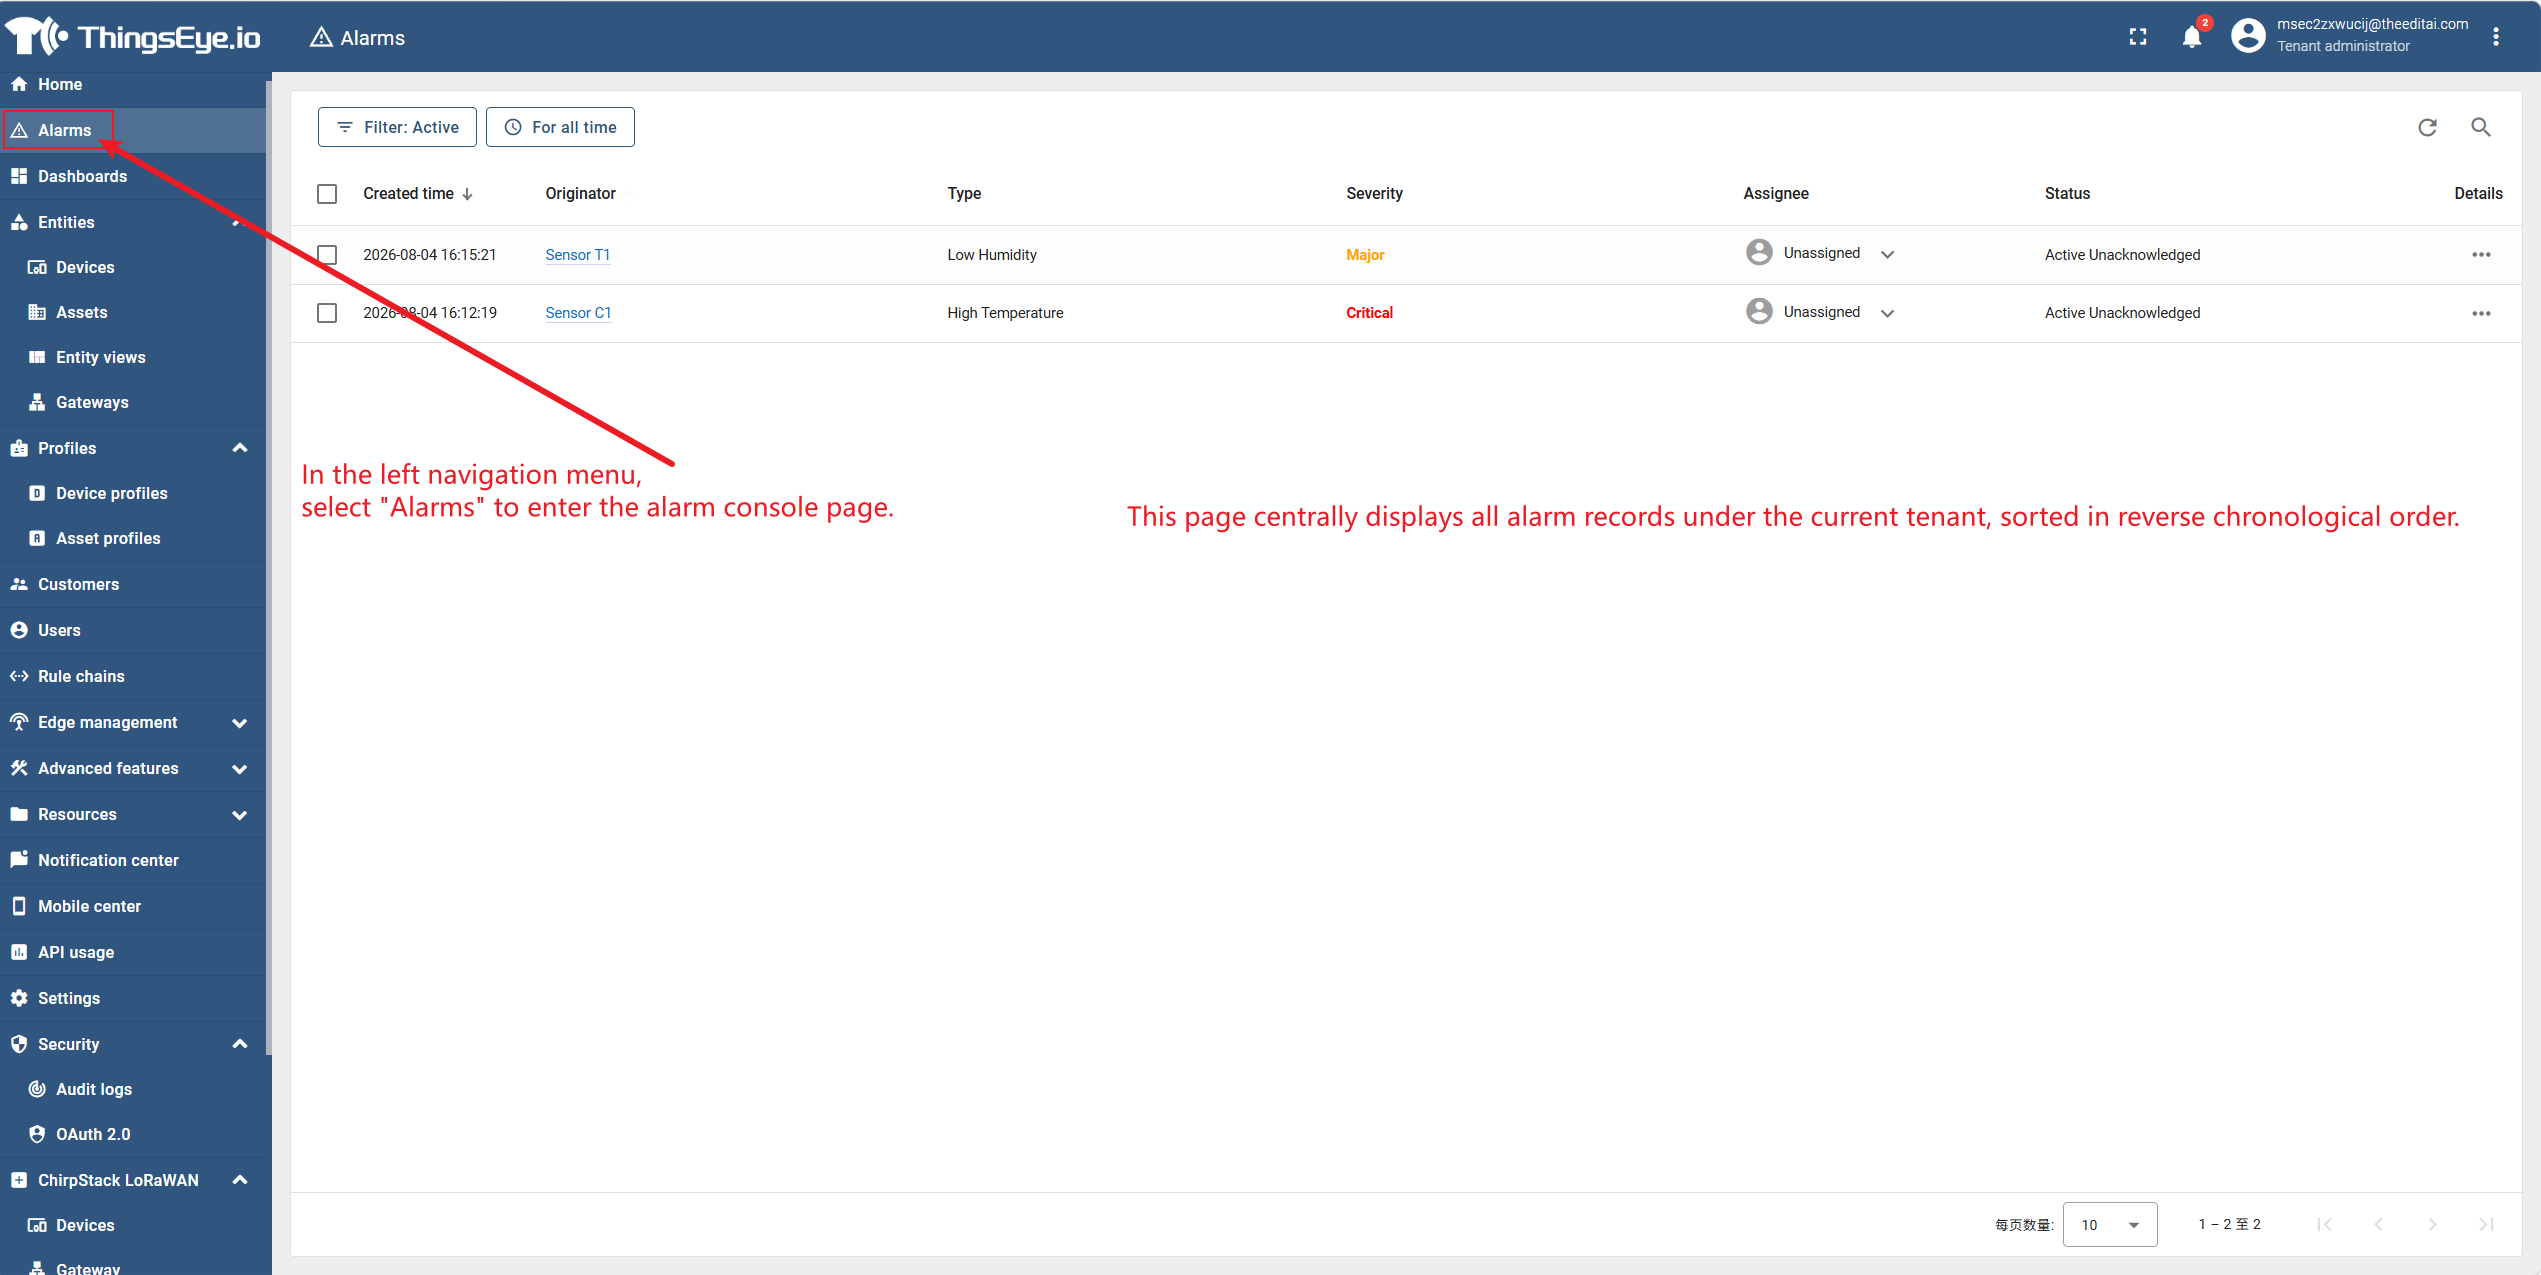
Step 1: Go to the alarm console
Select "Alarms" from the left navigation menu to go to the alarm console page. This page displays all alarm records under the current tenant, sorted in reverse chronological order.
Step 2: View the alarm list
The alarm list displays the core information of each alarm in a table format:
| Field | Description |
|---|---|
| Type | The alarm type name defined in the alarm rule |
| Severity | Alarm severity level (Critical / Major / Minor / Warning / Indeterminate), displayed as a colour‑coded label |
| Originator | The entity (device, asset, etc.) that triggered the alarm; click to navigate to the entity details page |
| Status | Alarm status: Active, Acknowledged, Cleared |
| Created Time | The time when the alarm was created |
| Acknowledged Time | The time when the alarm was acknowledged (if acknowledged) |
| Cleared Time | The time when the alarm was cleared (if cleared) |
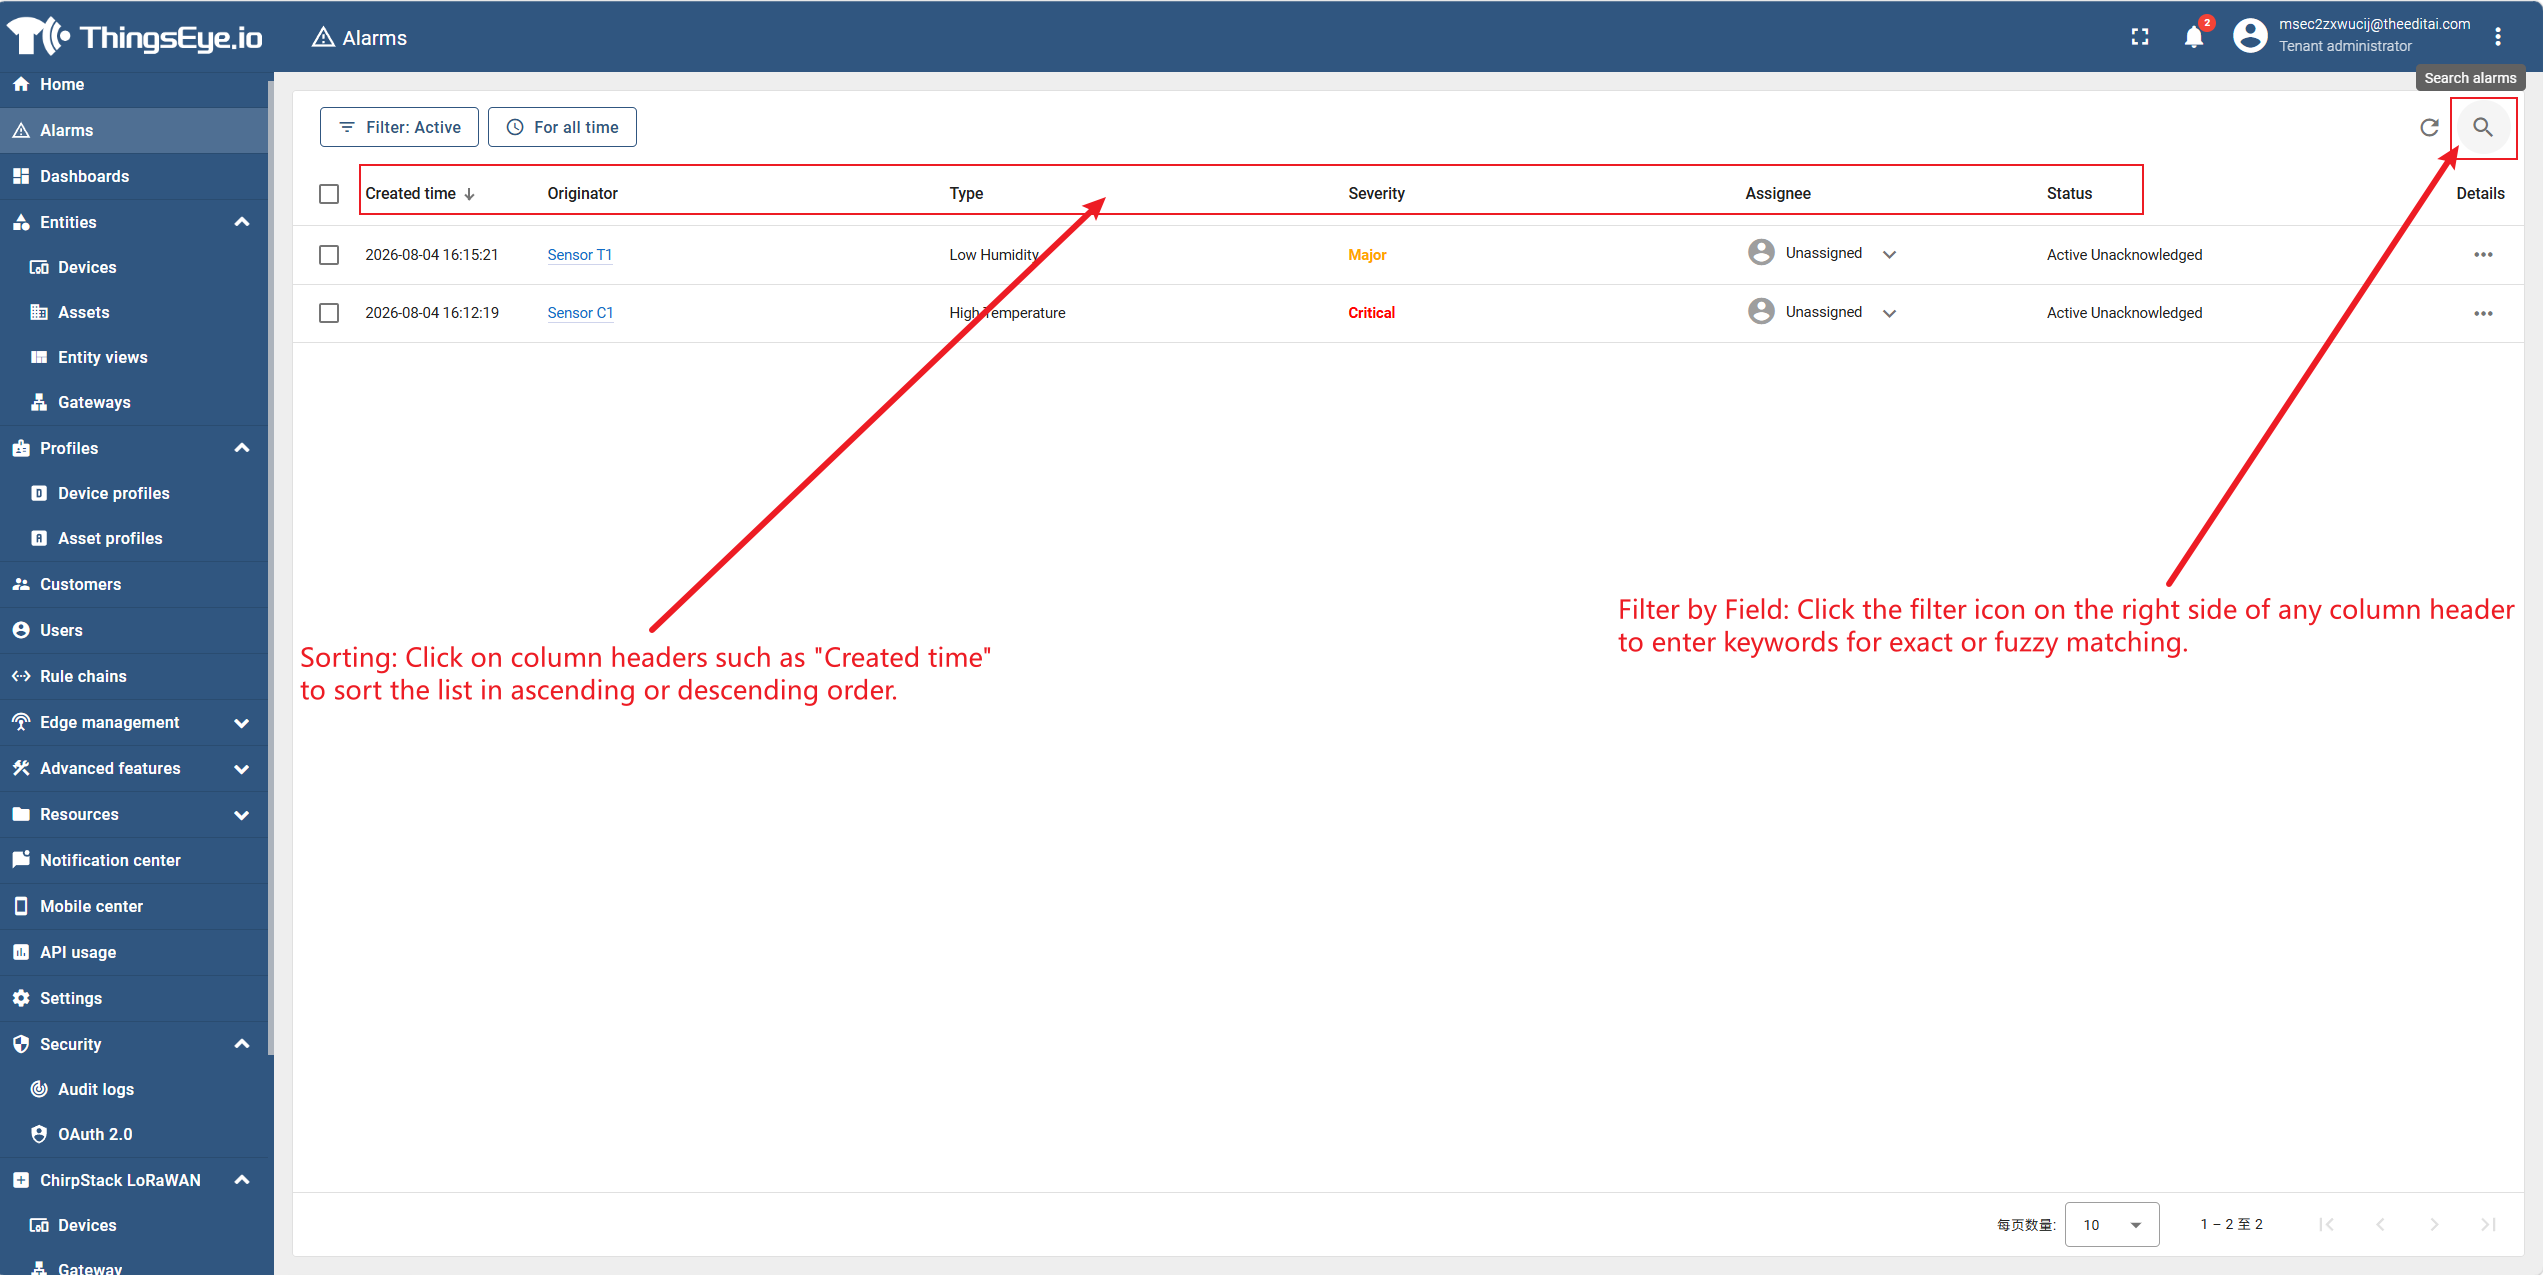
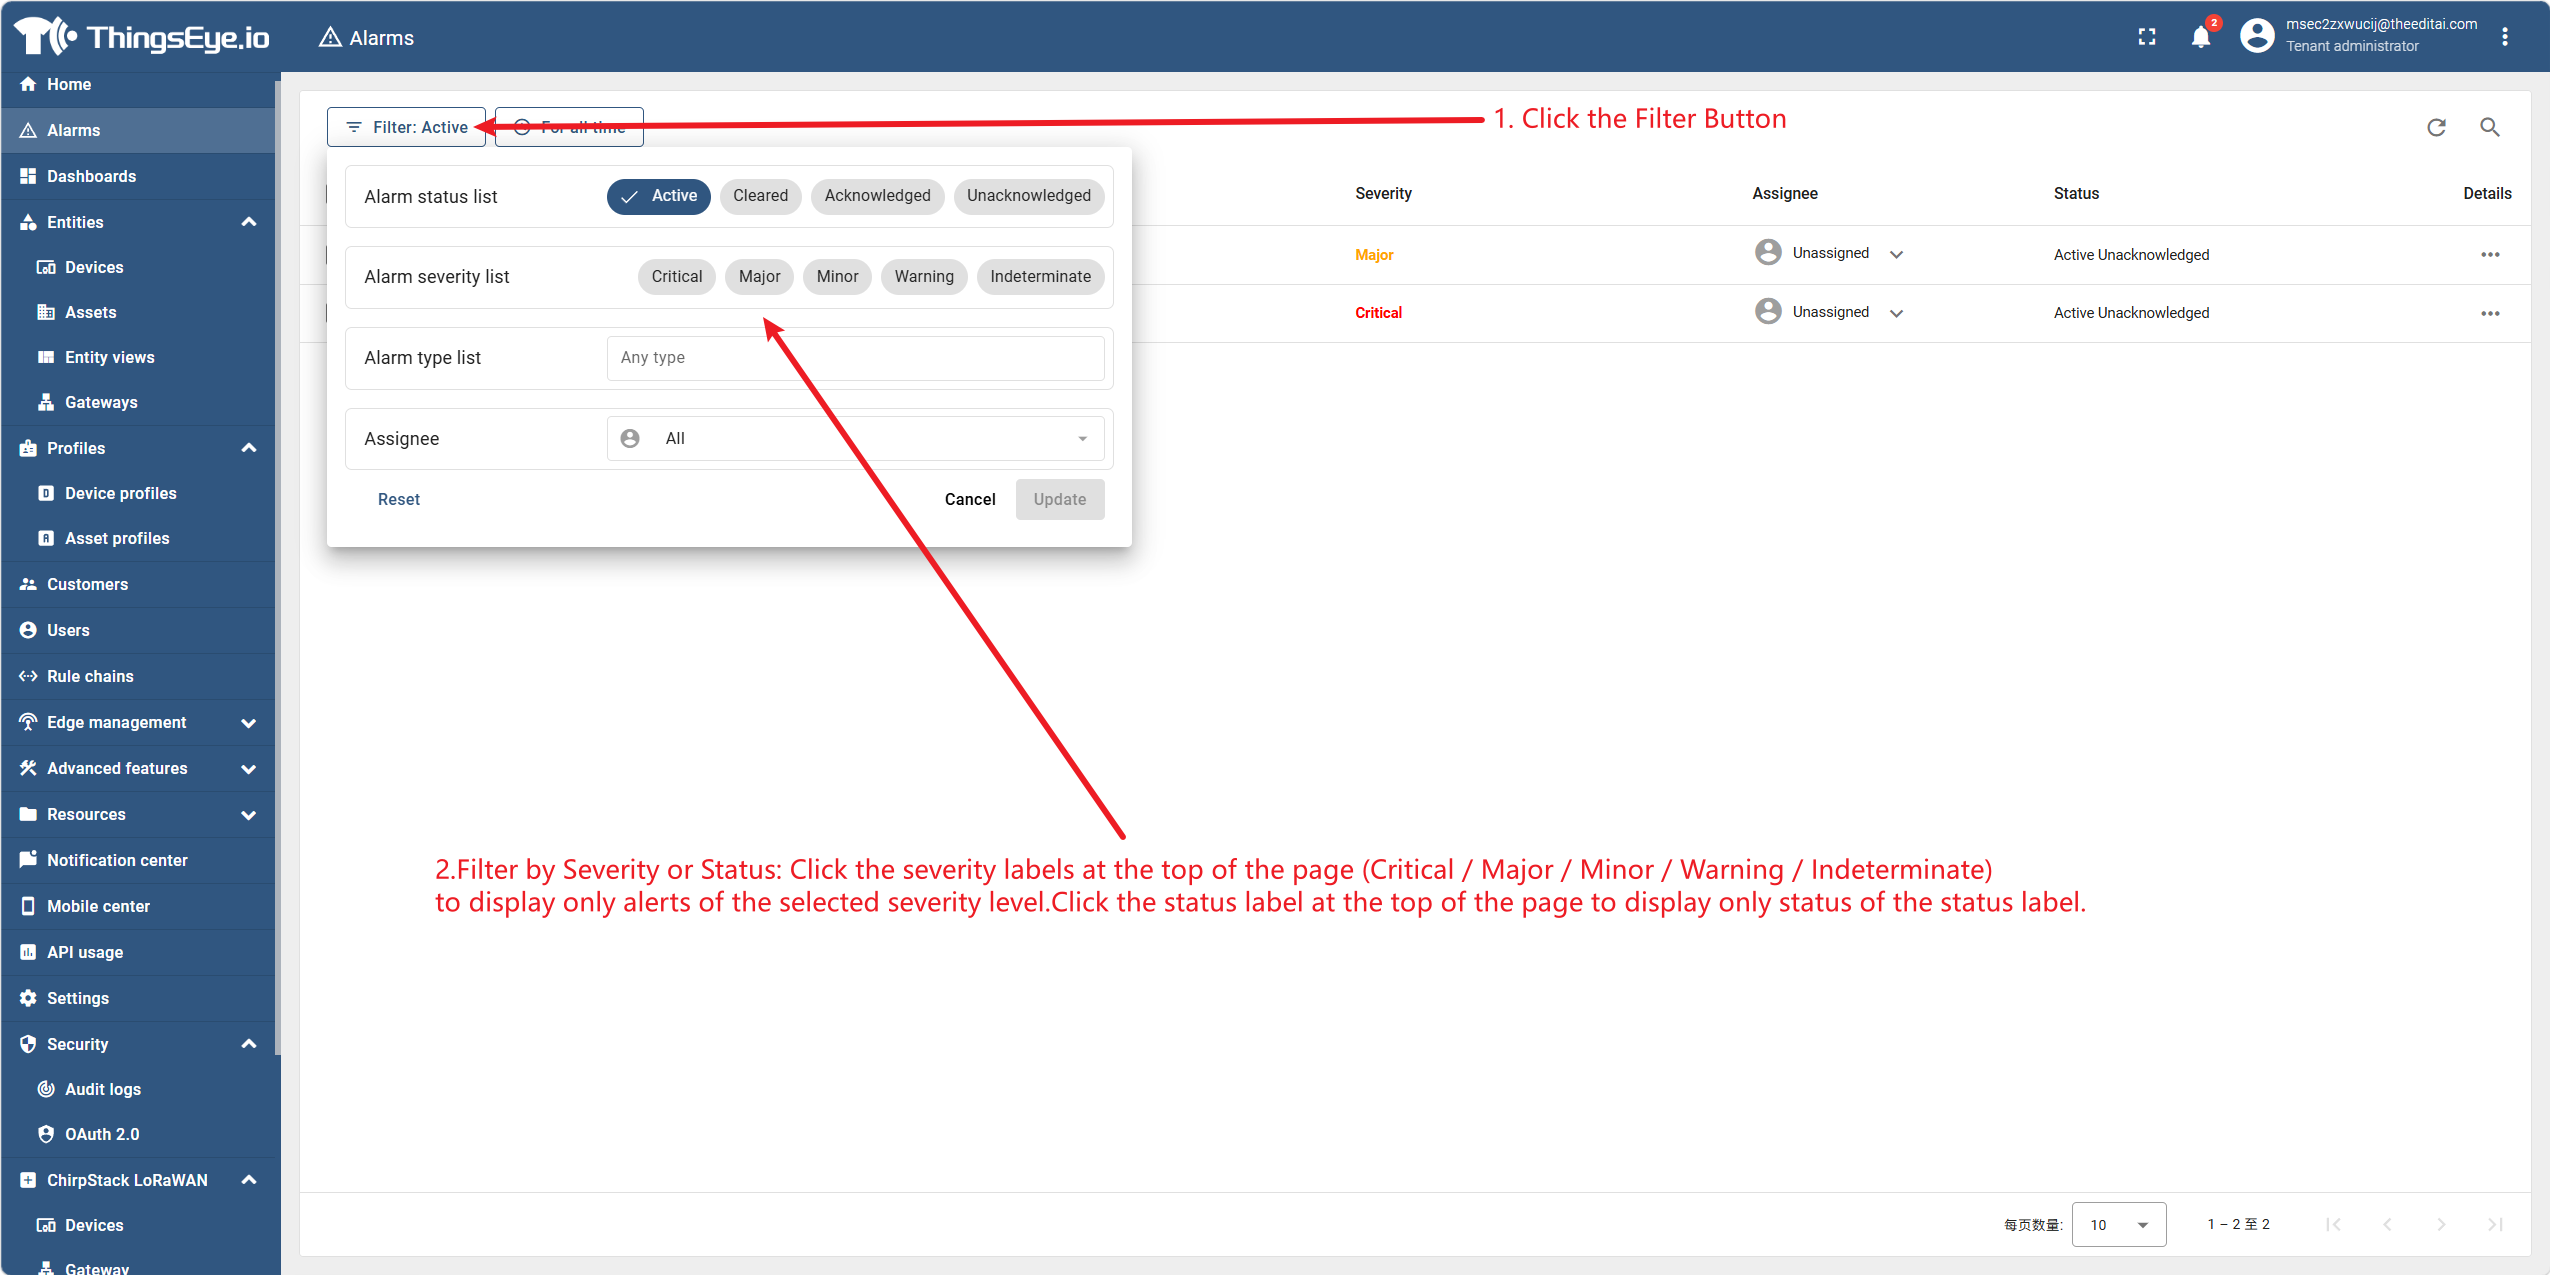
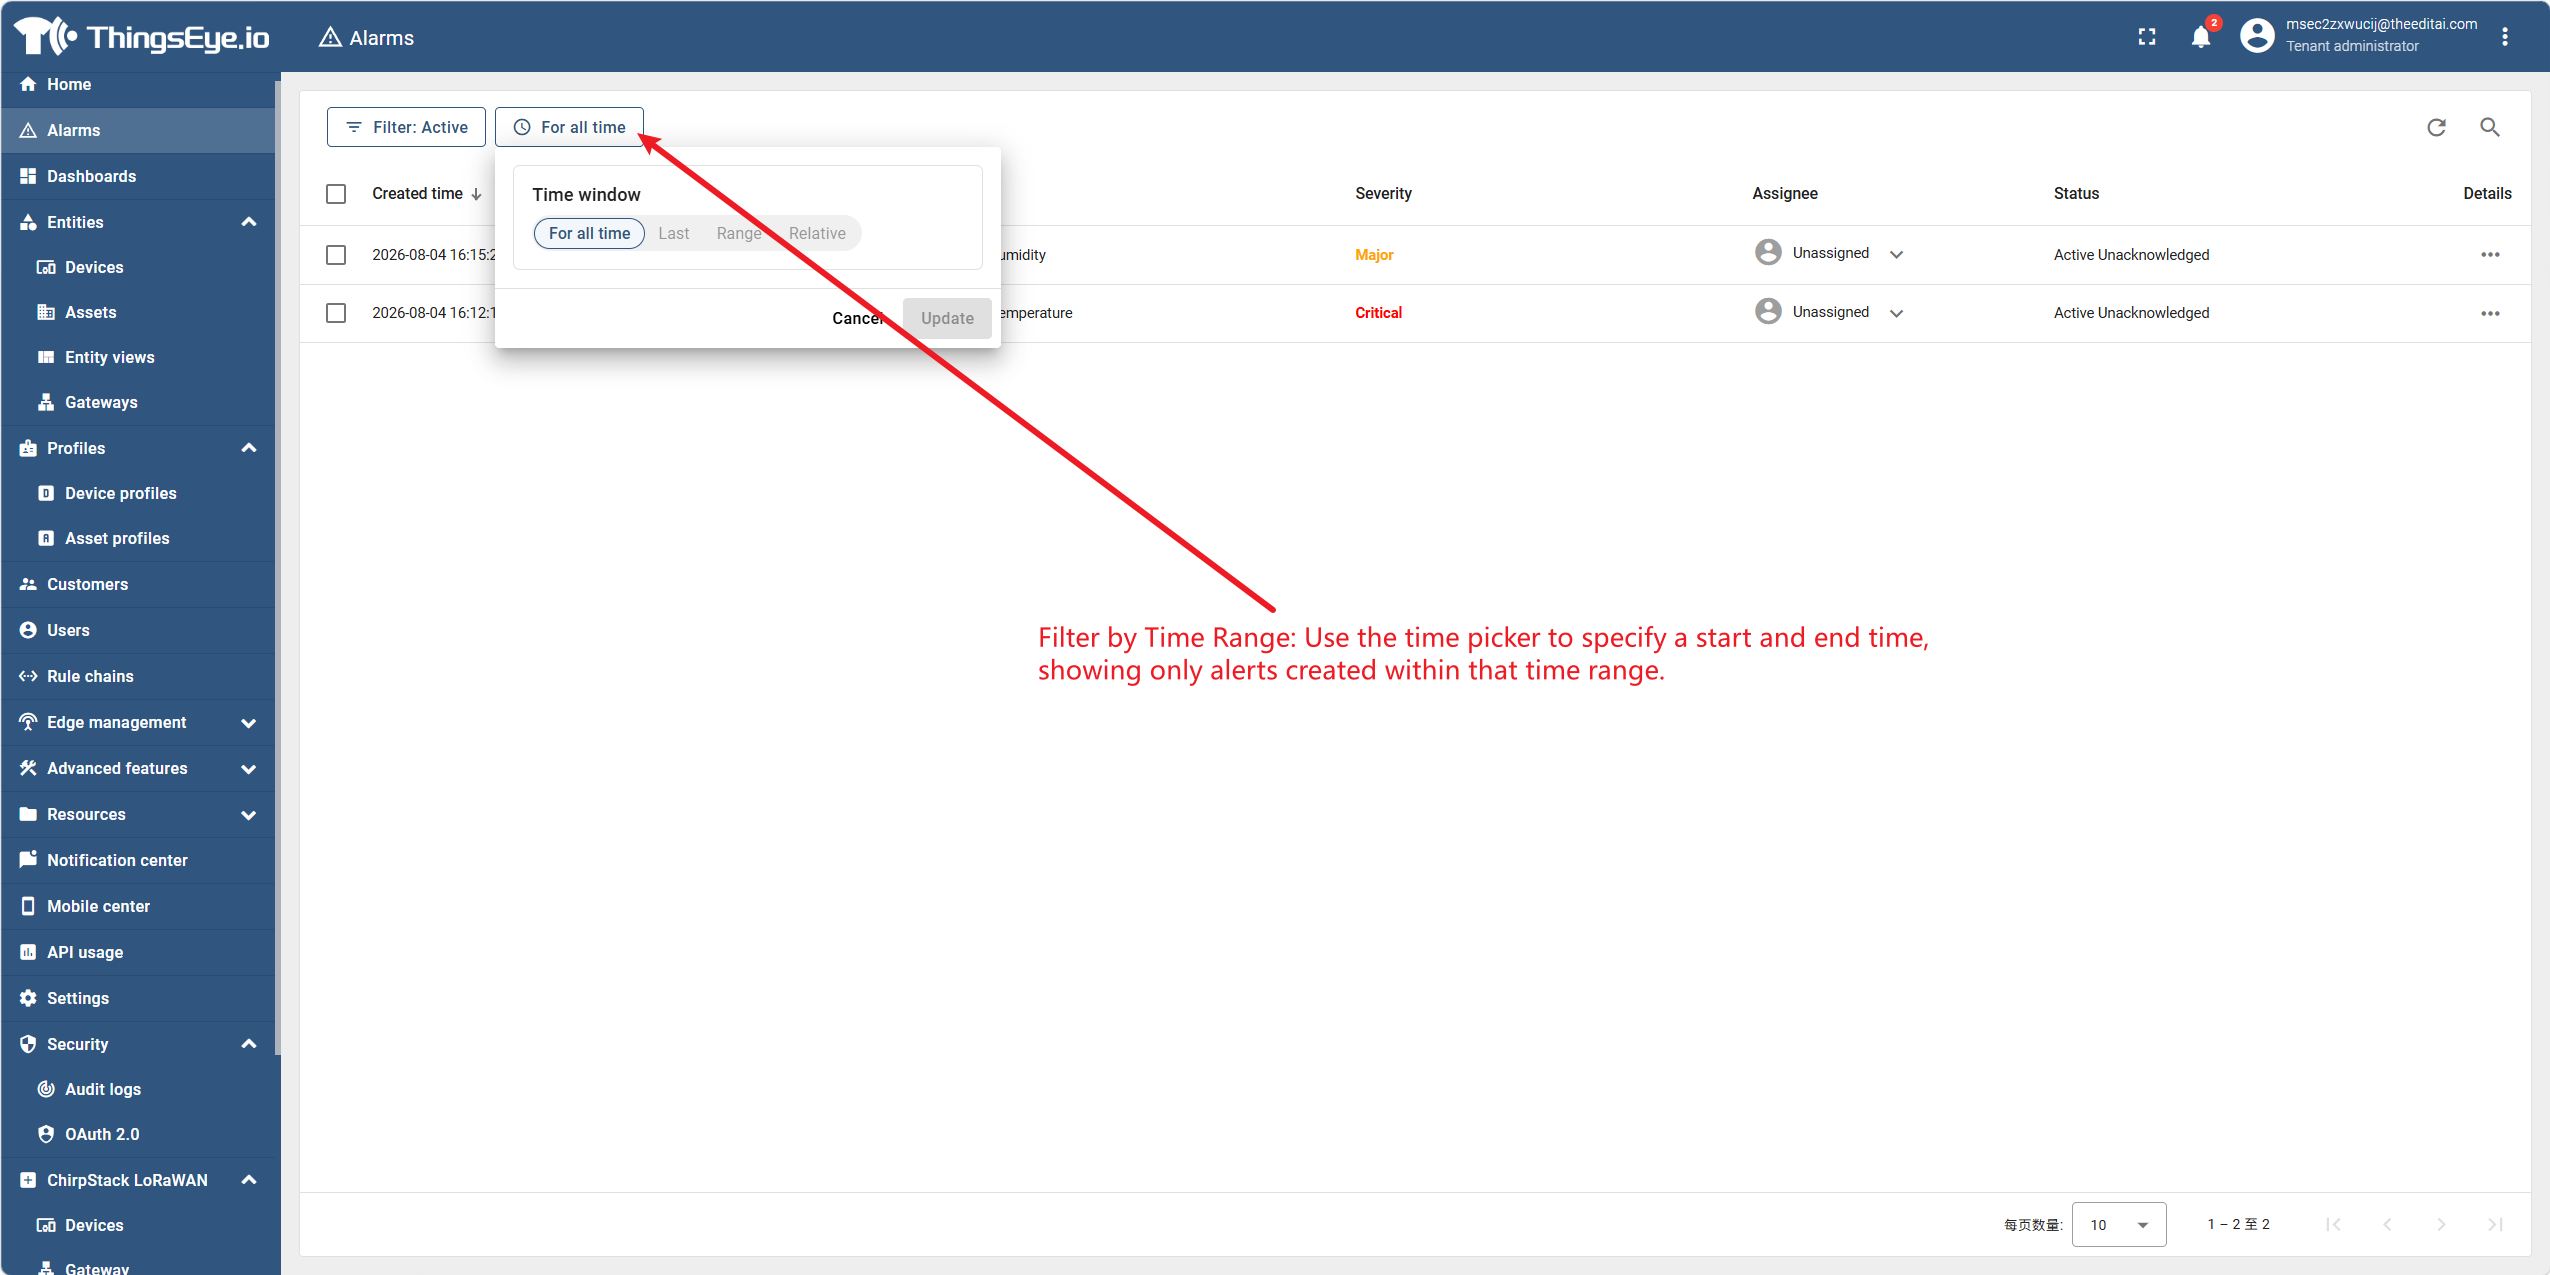
Step 3: Filter and sort
The alarm console provides multi‑dimensional filtering and sorting functions to help quickly locate alarms:
-
Filter by field: Click the filter icon on the right side of any column header and enter a keyword for exact or fuzzy matching. Multiple fields can be combined for filtering.
-
Filter by severity: Click the severity level labels at the top of the page (Critical / Major / Minor / Warning / Indeterminate / All) to display only alarms of the selected severity.
-
Filter by time range: Use the time picker to specify a start and end time to display only alarms created within that time range.
-
Sort: Click column headers such as "Created Time" to sort the list in ascending or descending order.
Step 4: View alarm details
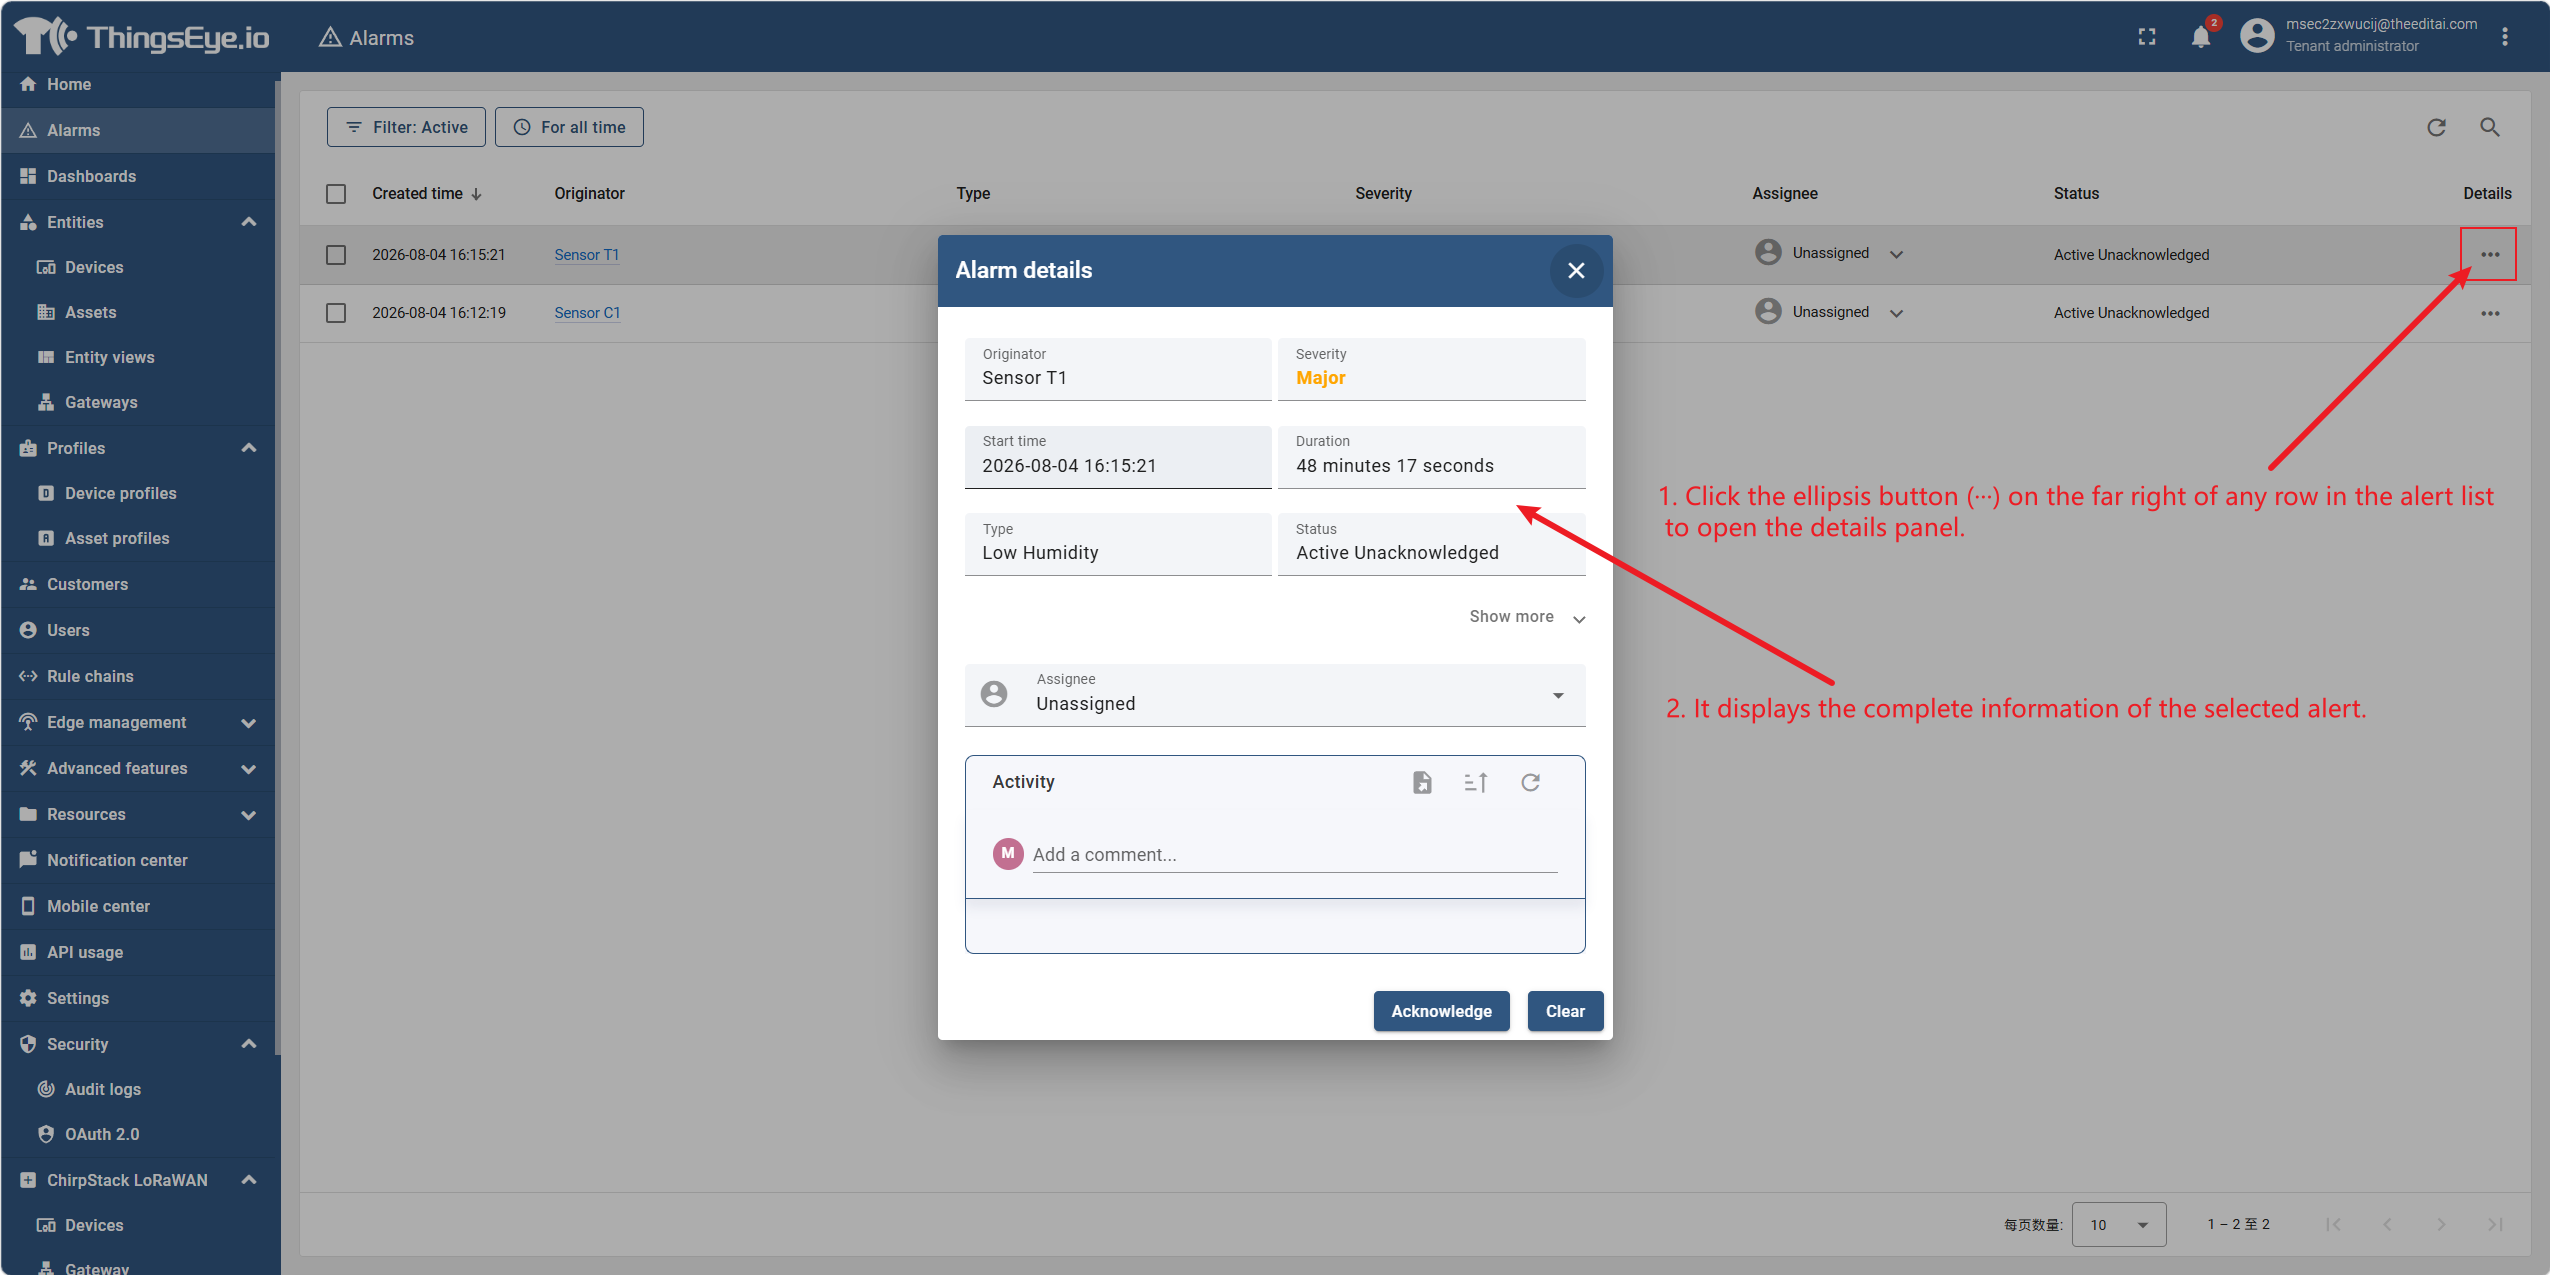
Click the ellipsis button (···) on the far right of any row in the alarm list to open the details panel, which displays the complete information of the selected alarm.
Step 5: Acknowledge the alarm
Acknowledging an alarm indicates that the operator has noticed the alarm and is handling it. After acknowledgment, the alarm status changes from "Active" to "Acknowledged".
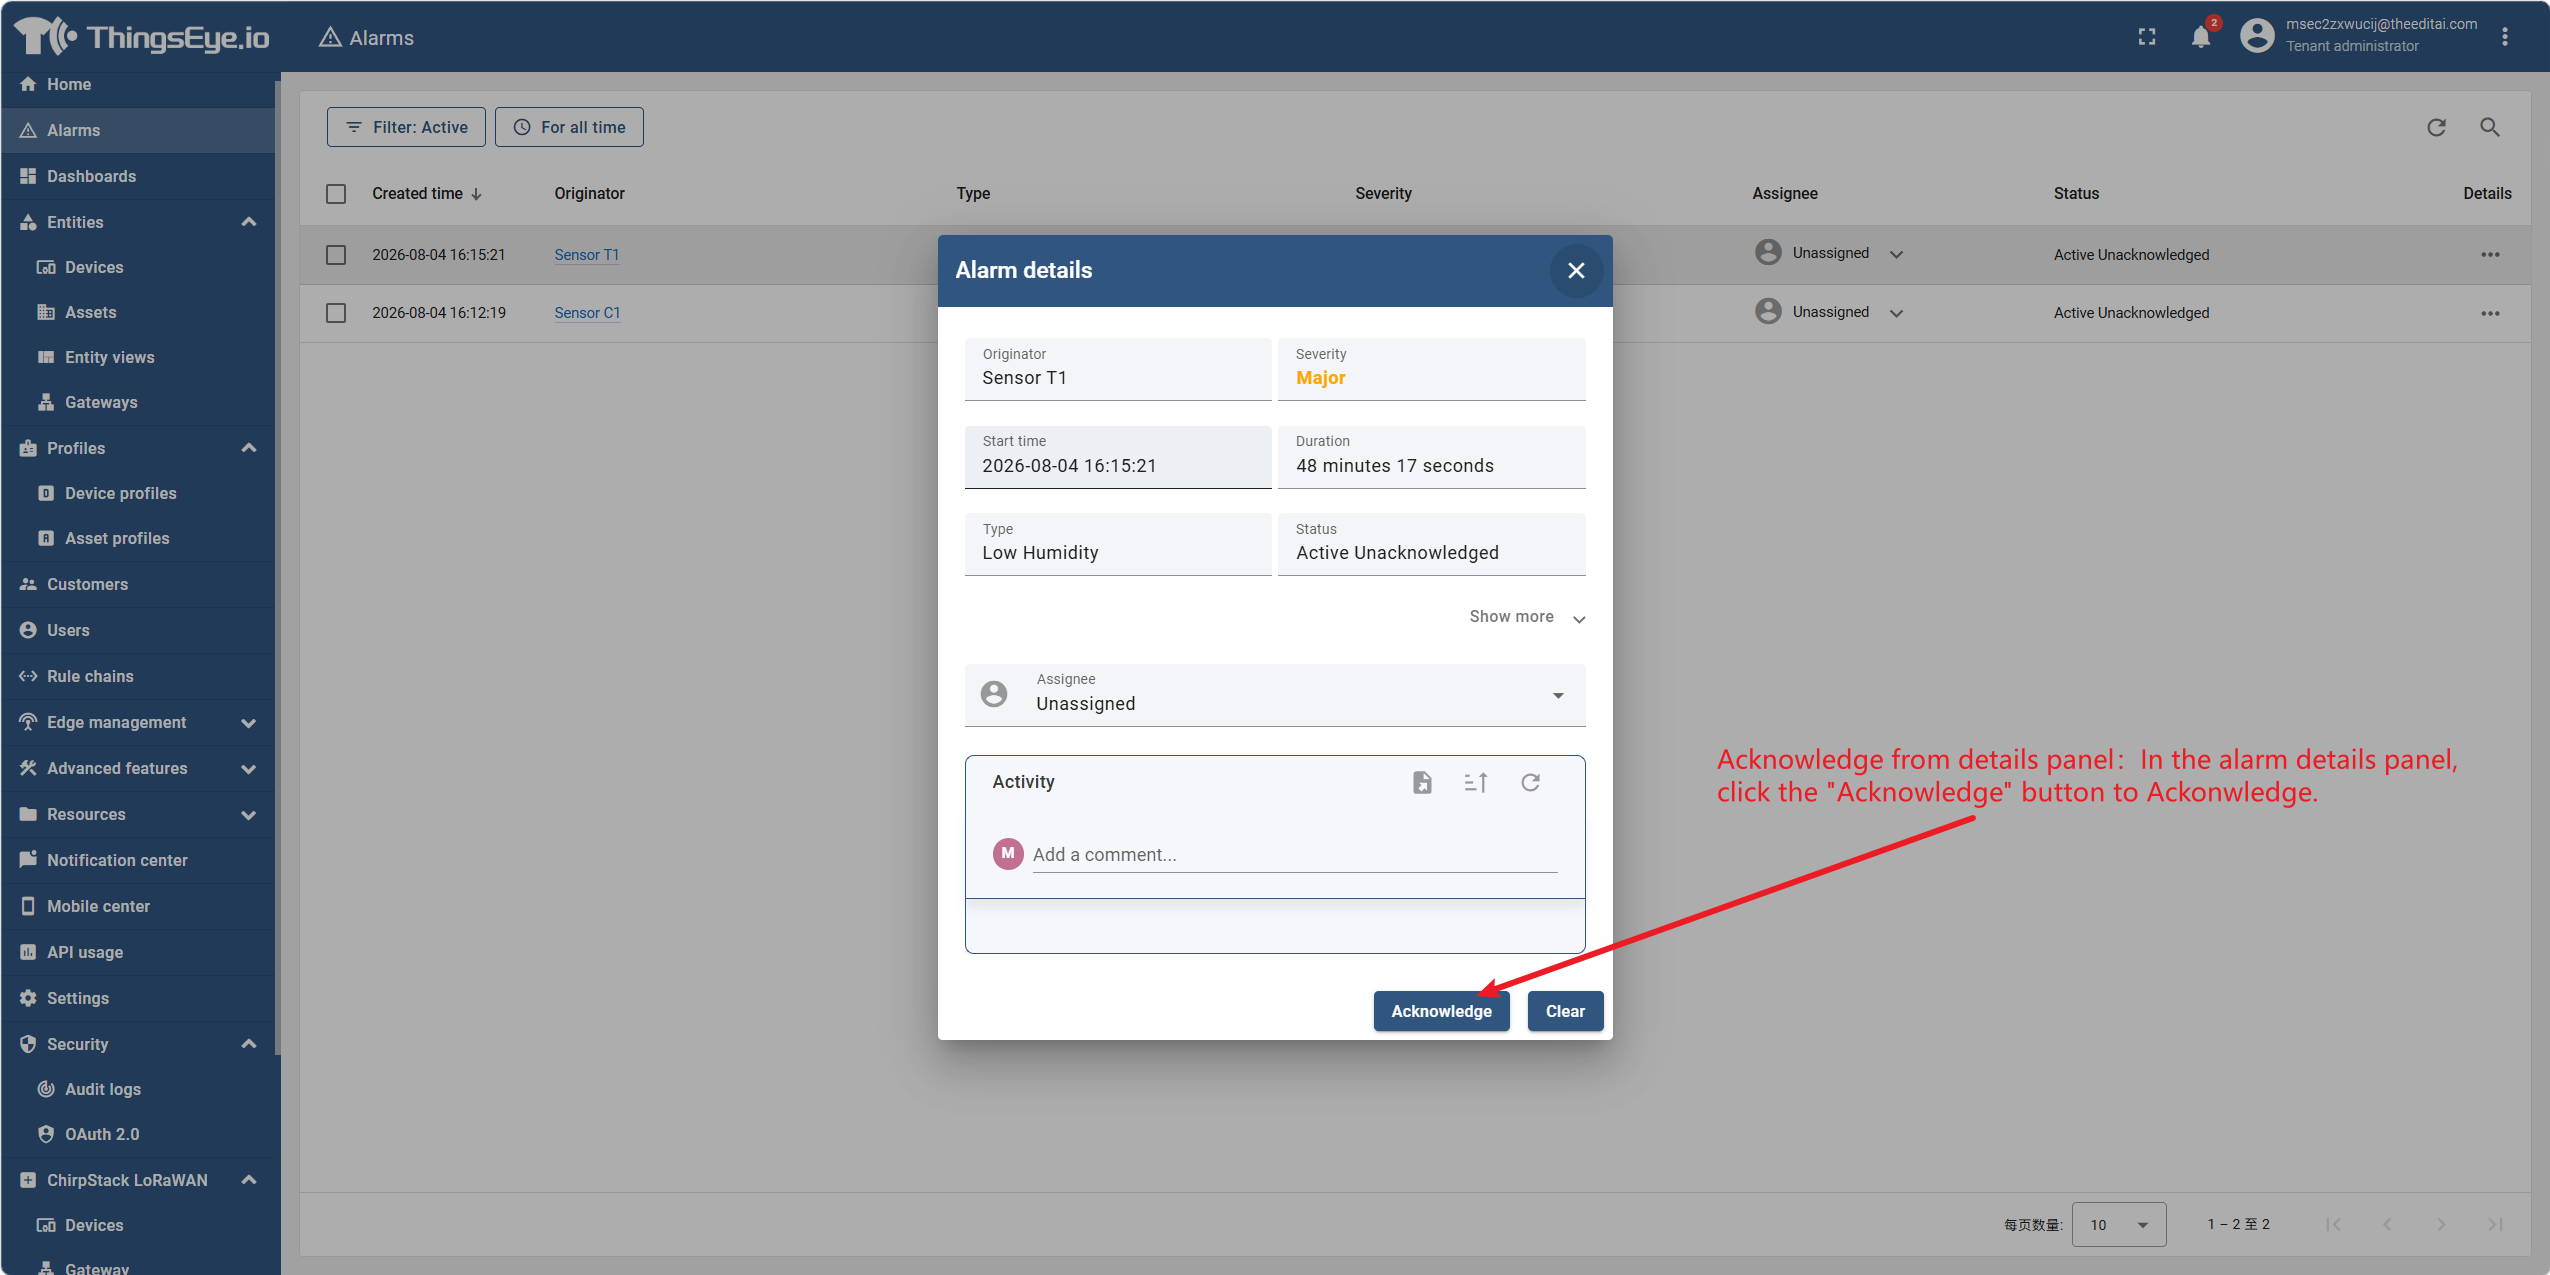
- Acknowledge from the details panel: In the alarm details panel, click the "Acknowledge" button.
Step 6: Clear the alarm
Clearing an alarm indicates that the issue has been resolved or no longer requires attention. After clearing, the alarm status changes to "Cleared" and is removed from the active alarm list (but can still be viewed in historical alarms).
-
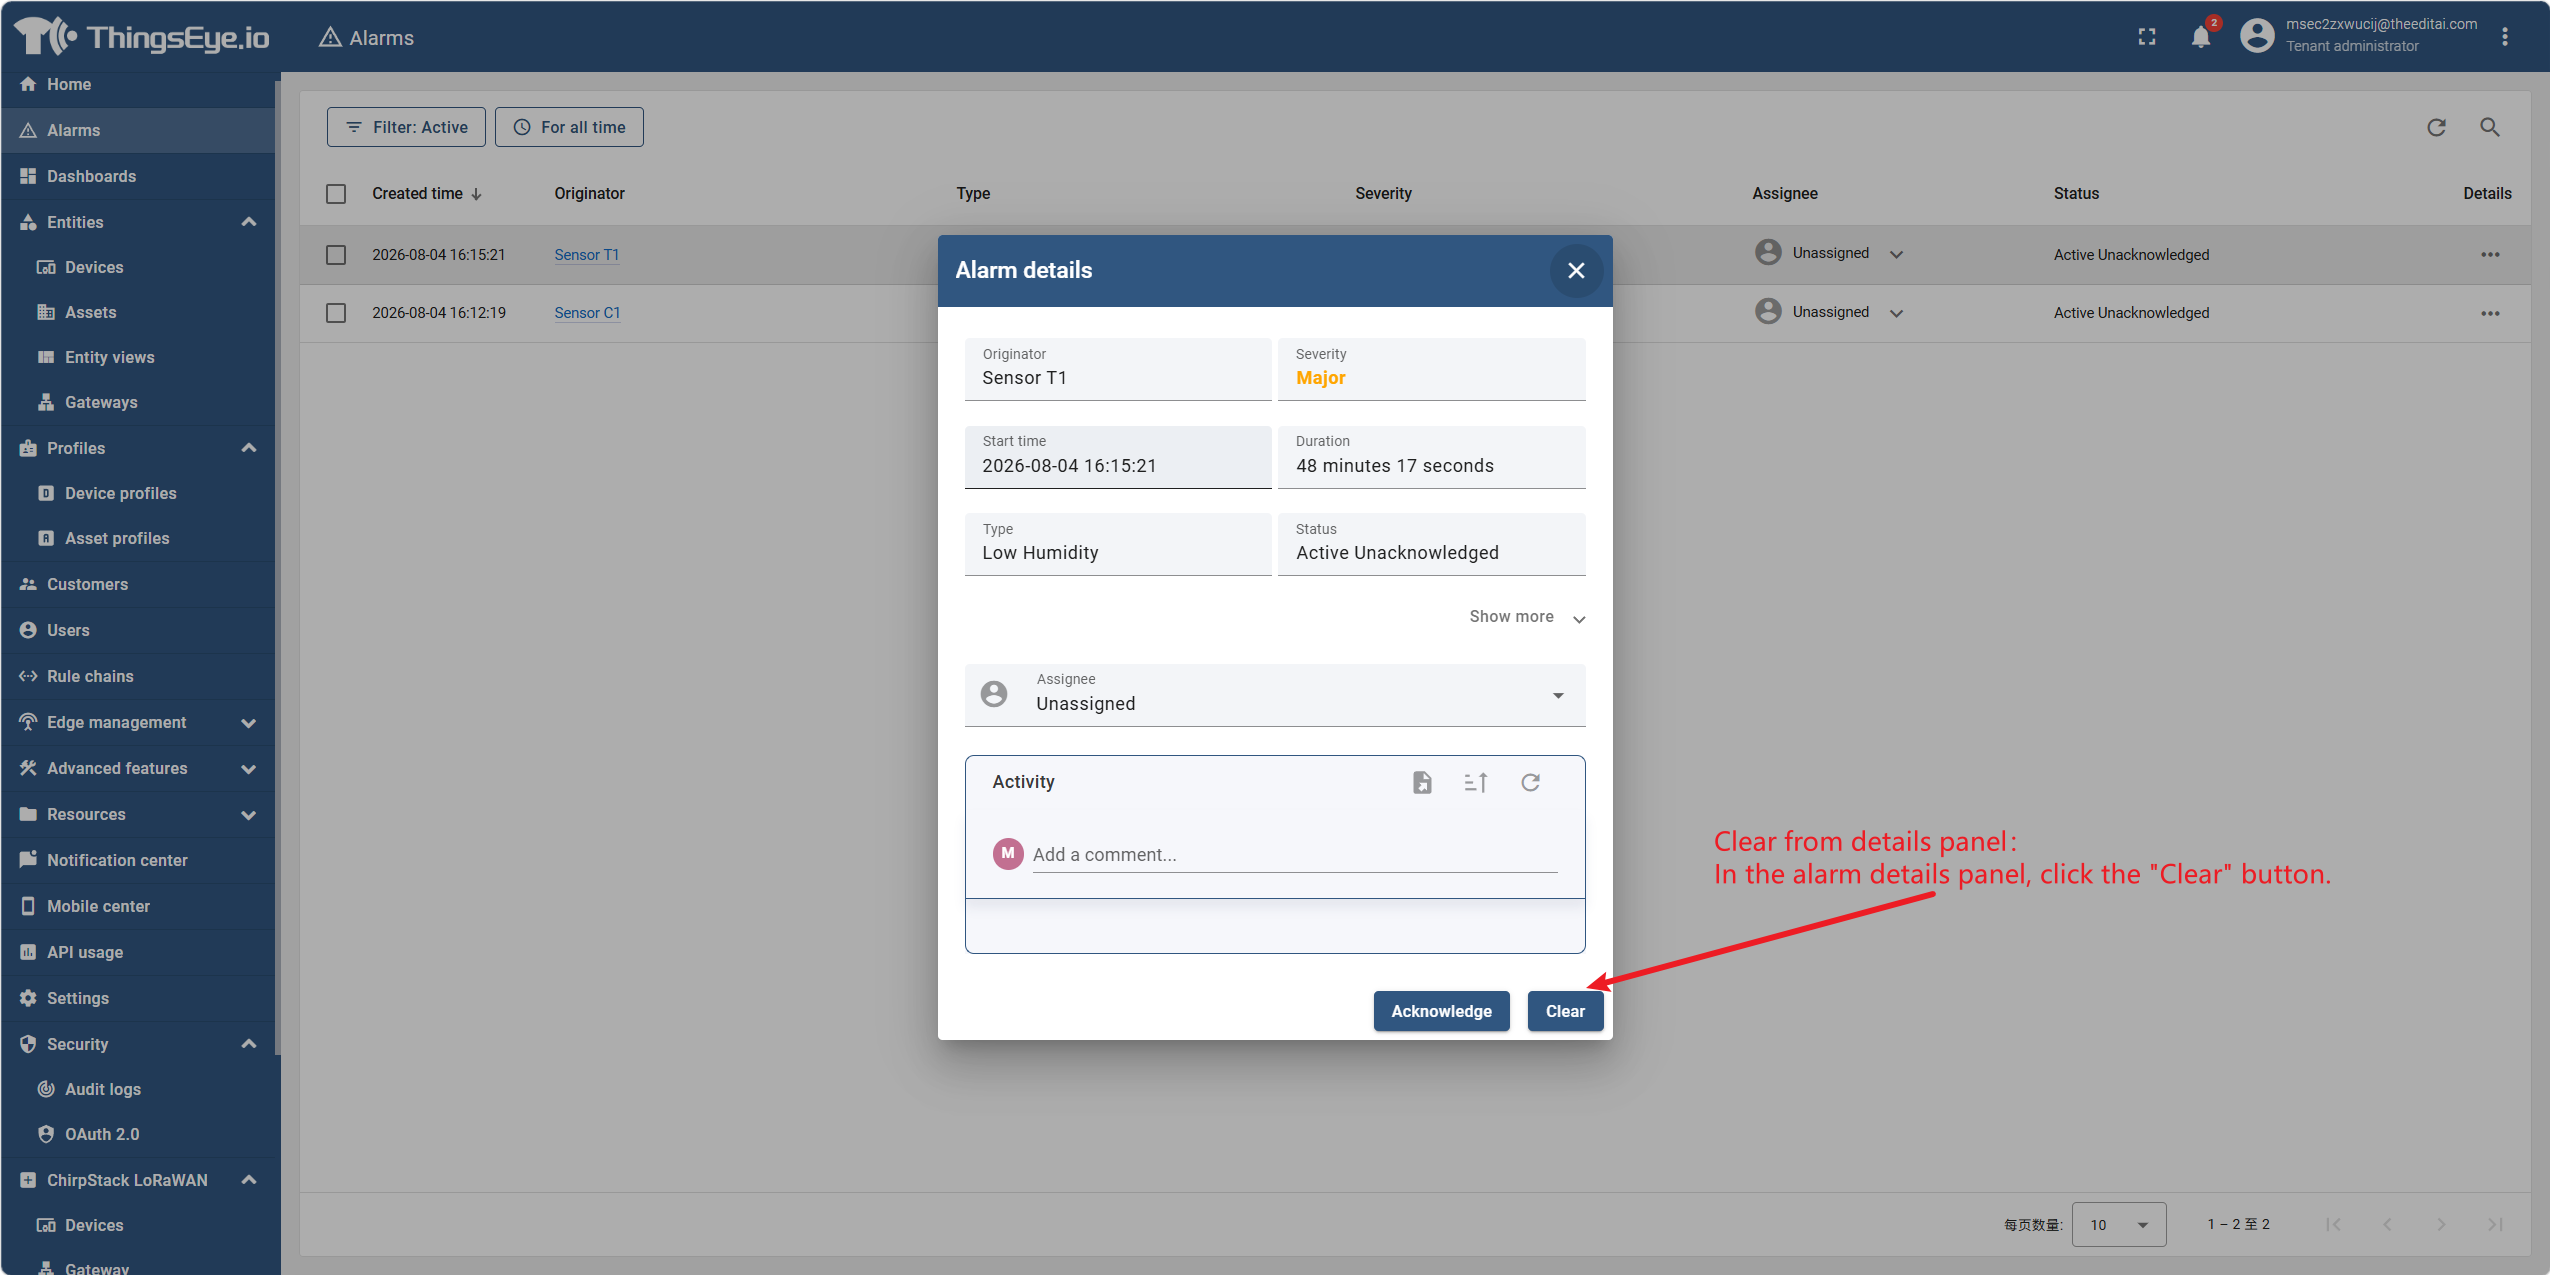
Method 1: Clear from the details panel: In the alarm details panel, click the "Clear" button.
-
Method 2: Auto‑clear: If a clearing condition is configured in the alarm rule, the alarm will be automatically cleared when the condition is met (no manual intervention required).

Note: After an alarm is cleared, a "Cleared" status indicator appears next to the severity label, and the status column in the list also updates to "Cleared". Cleared alarms remain in the alarm list (can be viewed via filters) but no longer appear in the active alarm view. Cleared alarms cannot be further operated on.
Step 7: Add a comment
The comment function is used to record contextual information about alarm handling, facilitating collaboration and sharing of processing progress and decision bases among multiple team members.
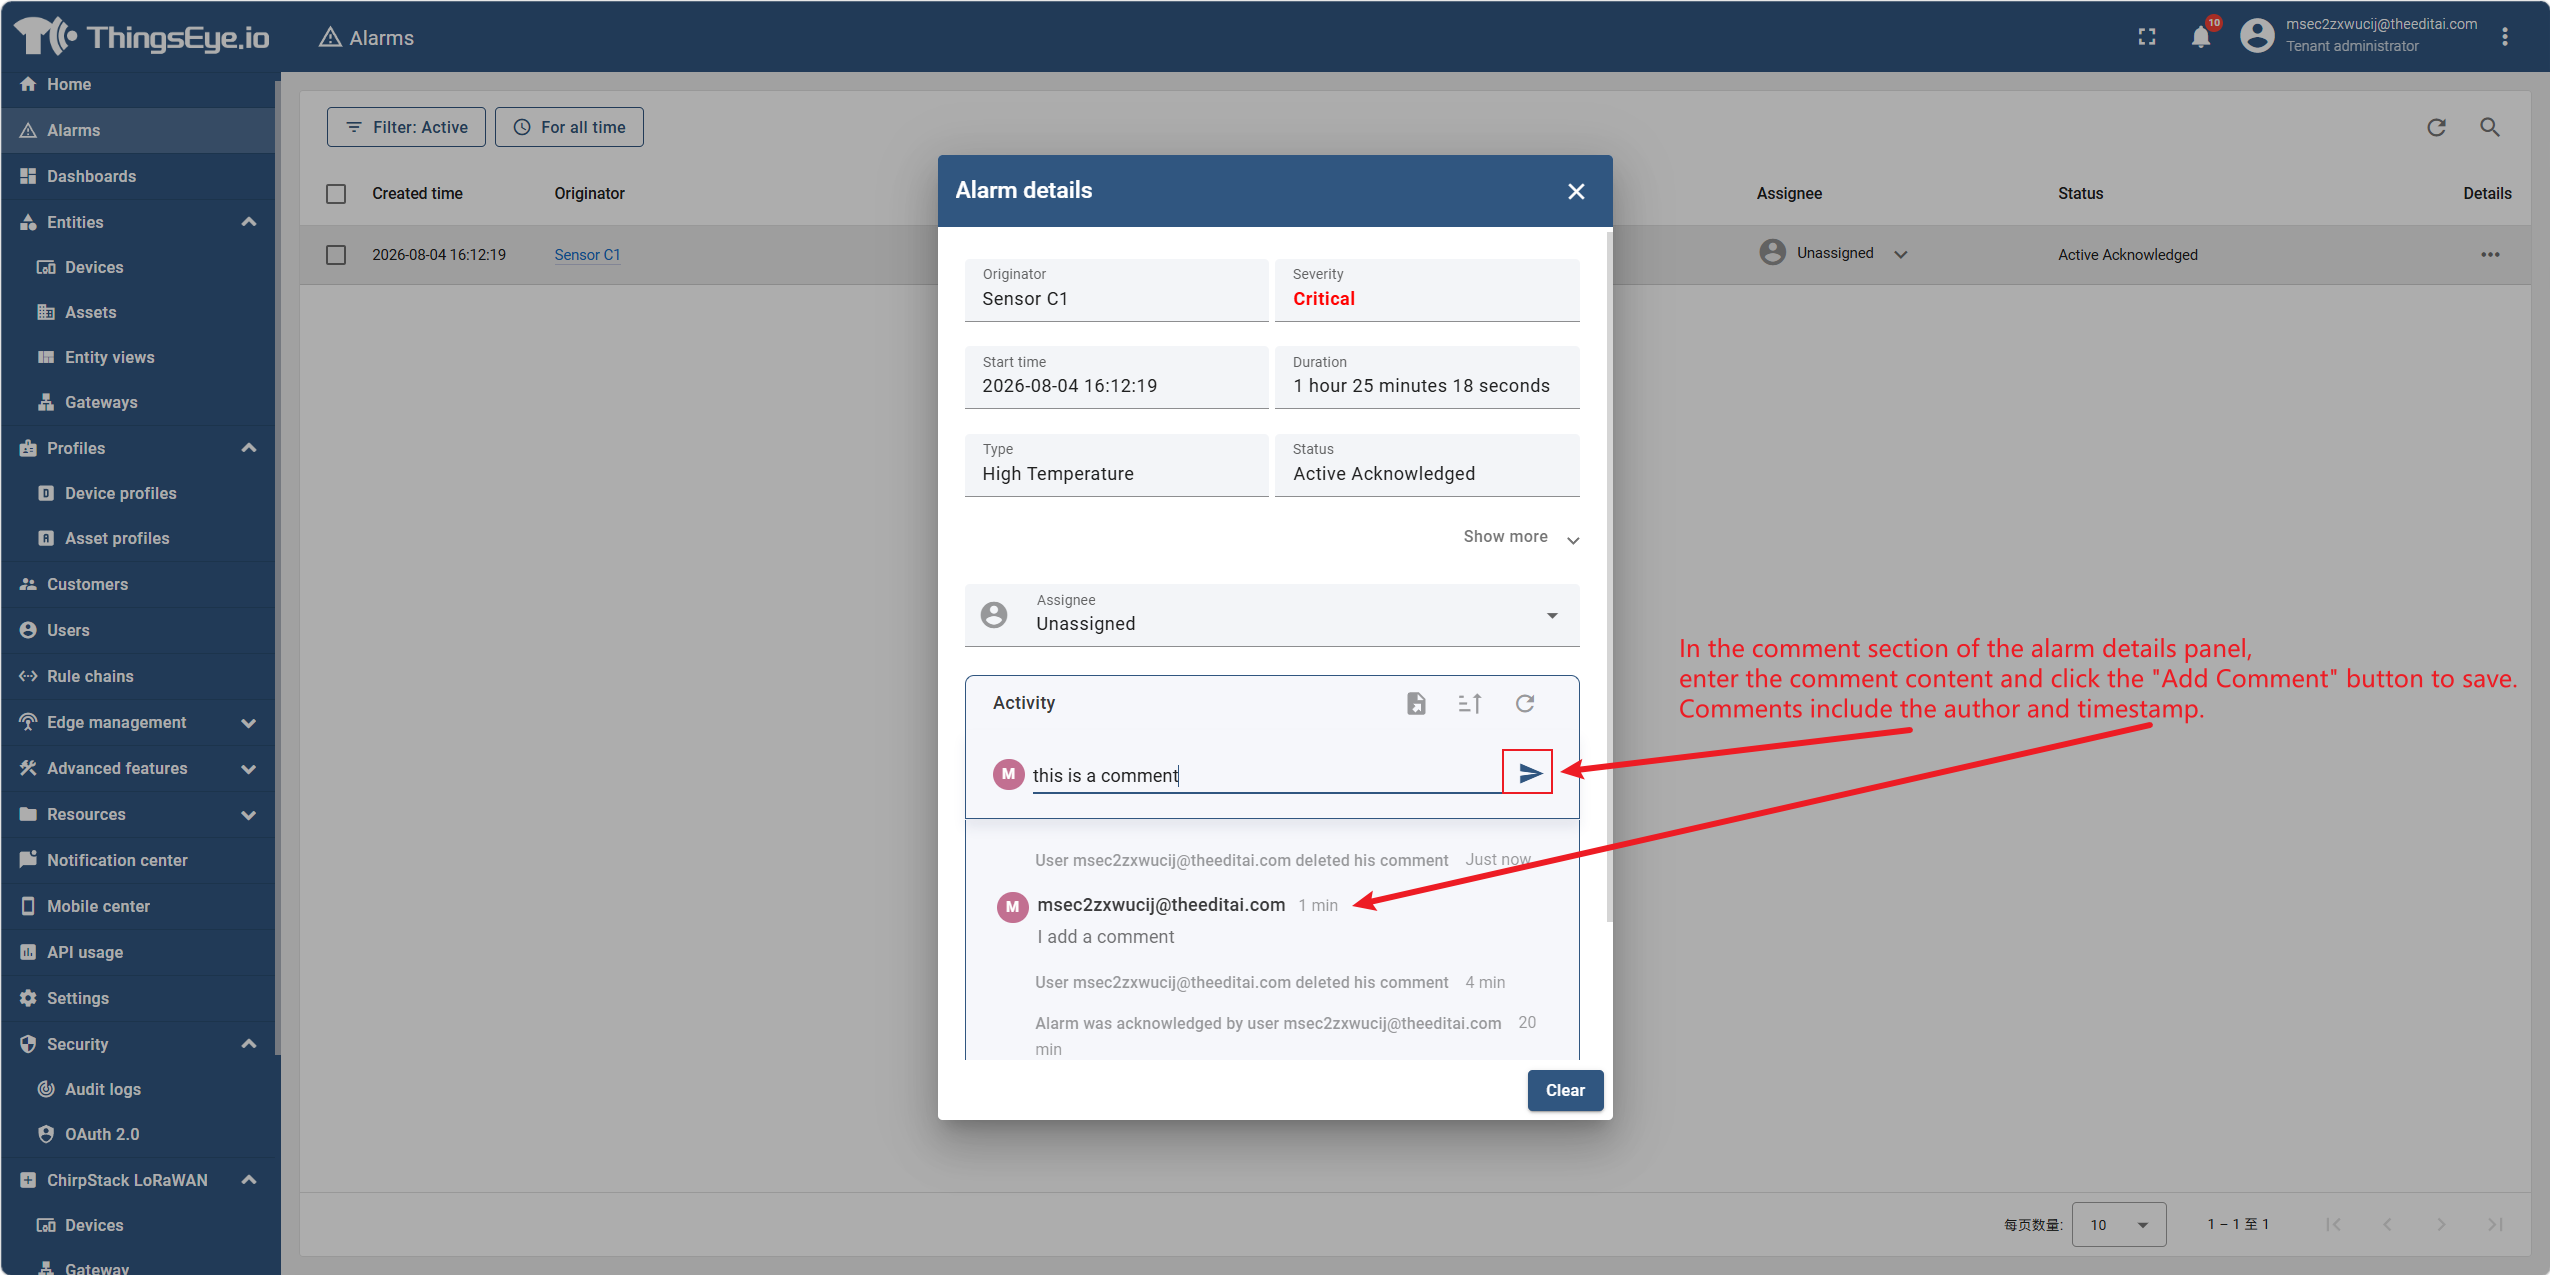
In the comment area of the alarm details panel, enter the comment content and click the "Add Comment" button to save. Comments include the author and timestamp.
Bulk Operations
The alarm list supports bulk operations for efficiently processing multiple alarms:
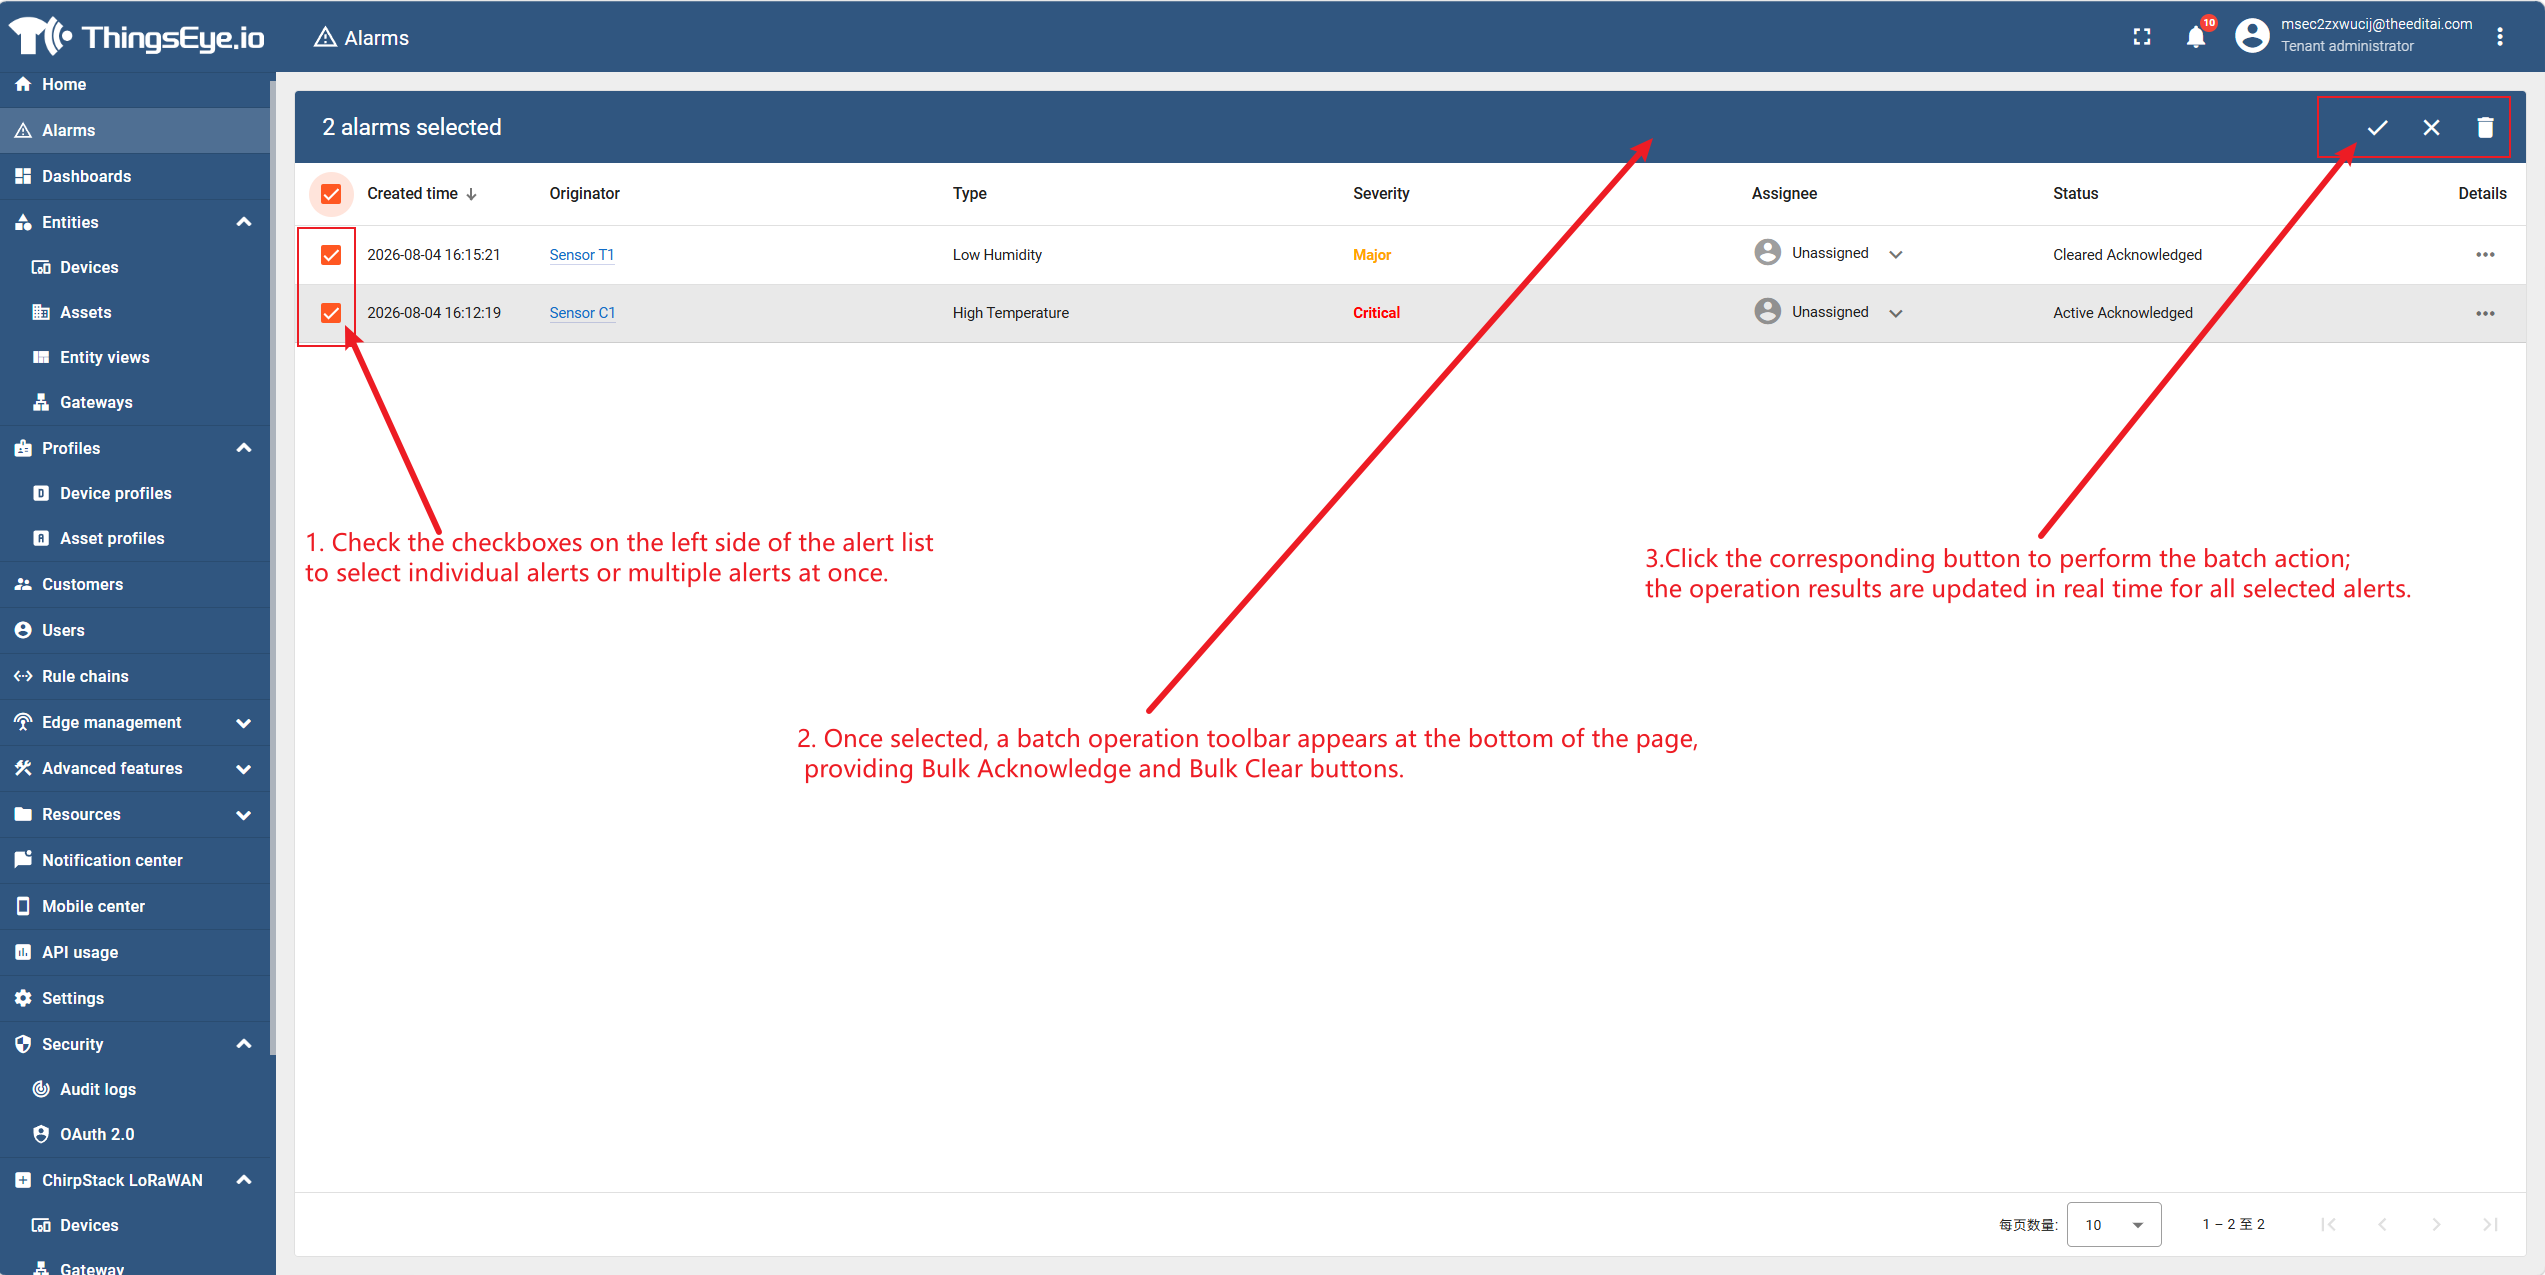
- Select the checkboxes on the left side of the alarm list to choose one or more alarms.
- After selection, a bulk operation toolbar appears at the bottom of the page, providing "Bulk Acknowledge" and "Bulk Clear" buttons.
- Click the corresponding button to perform the bulk operation; the results of all selected alarms are updated in real time.
Note: Bulk operations are irreversible. Before execution, ensure that all selected alarms are intended targets for the same operation.