Dashboard Management
Overview
Applicable Role: Tenant Administrator.
Dashboards are the core visualisation components of the ThingsEye platform. Tenant Administrators can use various widget types such as charts, cards, tables, and controls to centrally display real‑time and historical data reported by devices and assets, building monitoring dashboards adapted to different business scenarios.
This chapter introduces the following operations in sequence according to the dashboard lifecycle: creating a blank dashboard and configuring its basic properties; adding various visualisation widgets (charts, tables, alarm lists, etc.) in the editing interface; configuring widget data sources (device/asset time‑series data, attribute data, entity aliases, etc.); publishing, making public, or assigning completed dashboards to specific customers; and deleting dashboards that are no longer in use.
Permission Note: End‑Users do not have permission to create, edit, or delete dashboards; they can only view dashboards assigned or made public by Tenant Administrators. For viewing operations, see "View Dashboards".
Design Constraints (Must Read): All devices/assets referenced by dashboard widgets must have the same visibility scope as the dashboard itself (either assigned to the same customer or public). If the underlying devices/assets are not visible to the target user, even if the dashboard has been assigned, the widget will display "No data" and the platform will not report an error. It is recommended to complete the visibility configuration of associated devices and assets before assigning the dashboard.
1. Create a Dashboard
Procedure
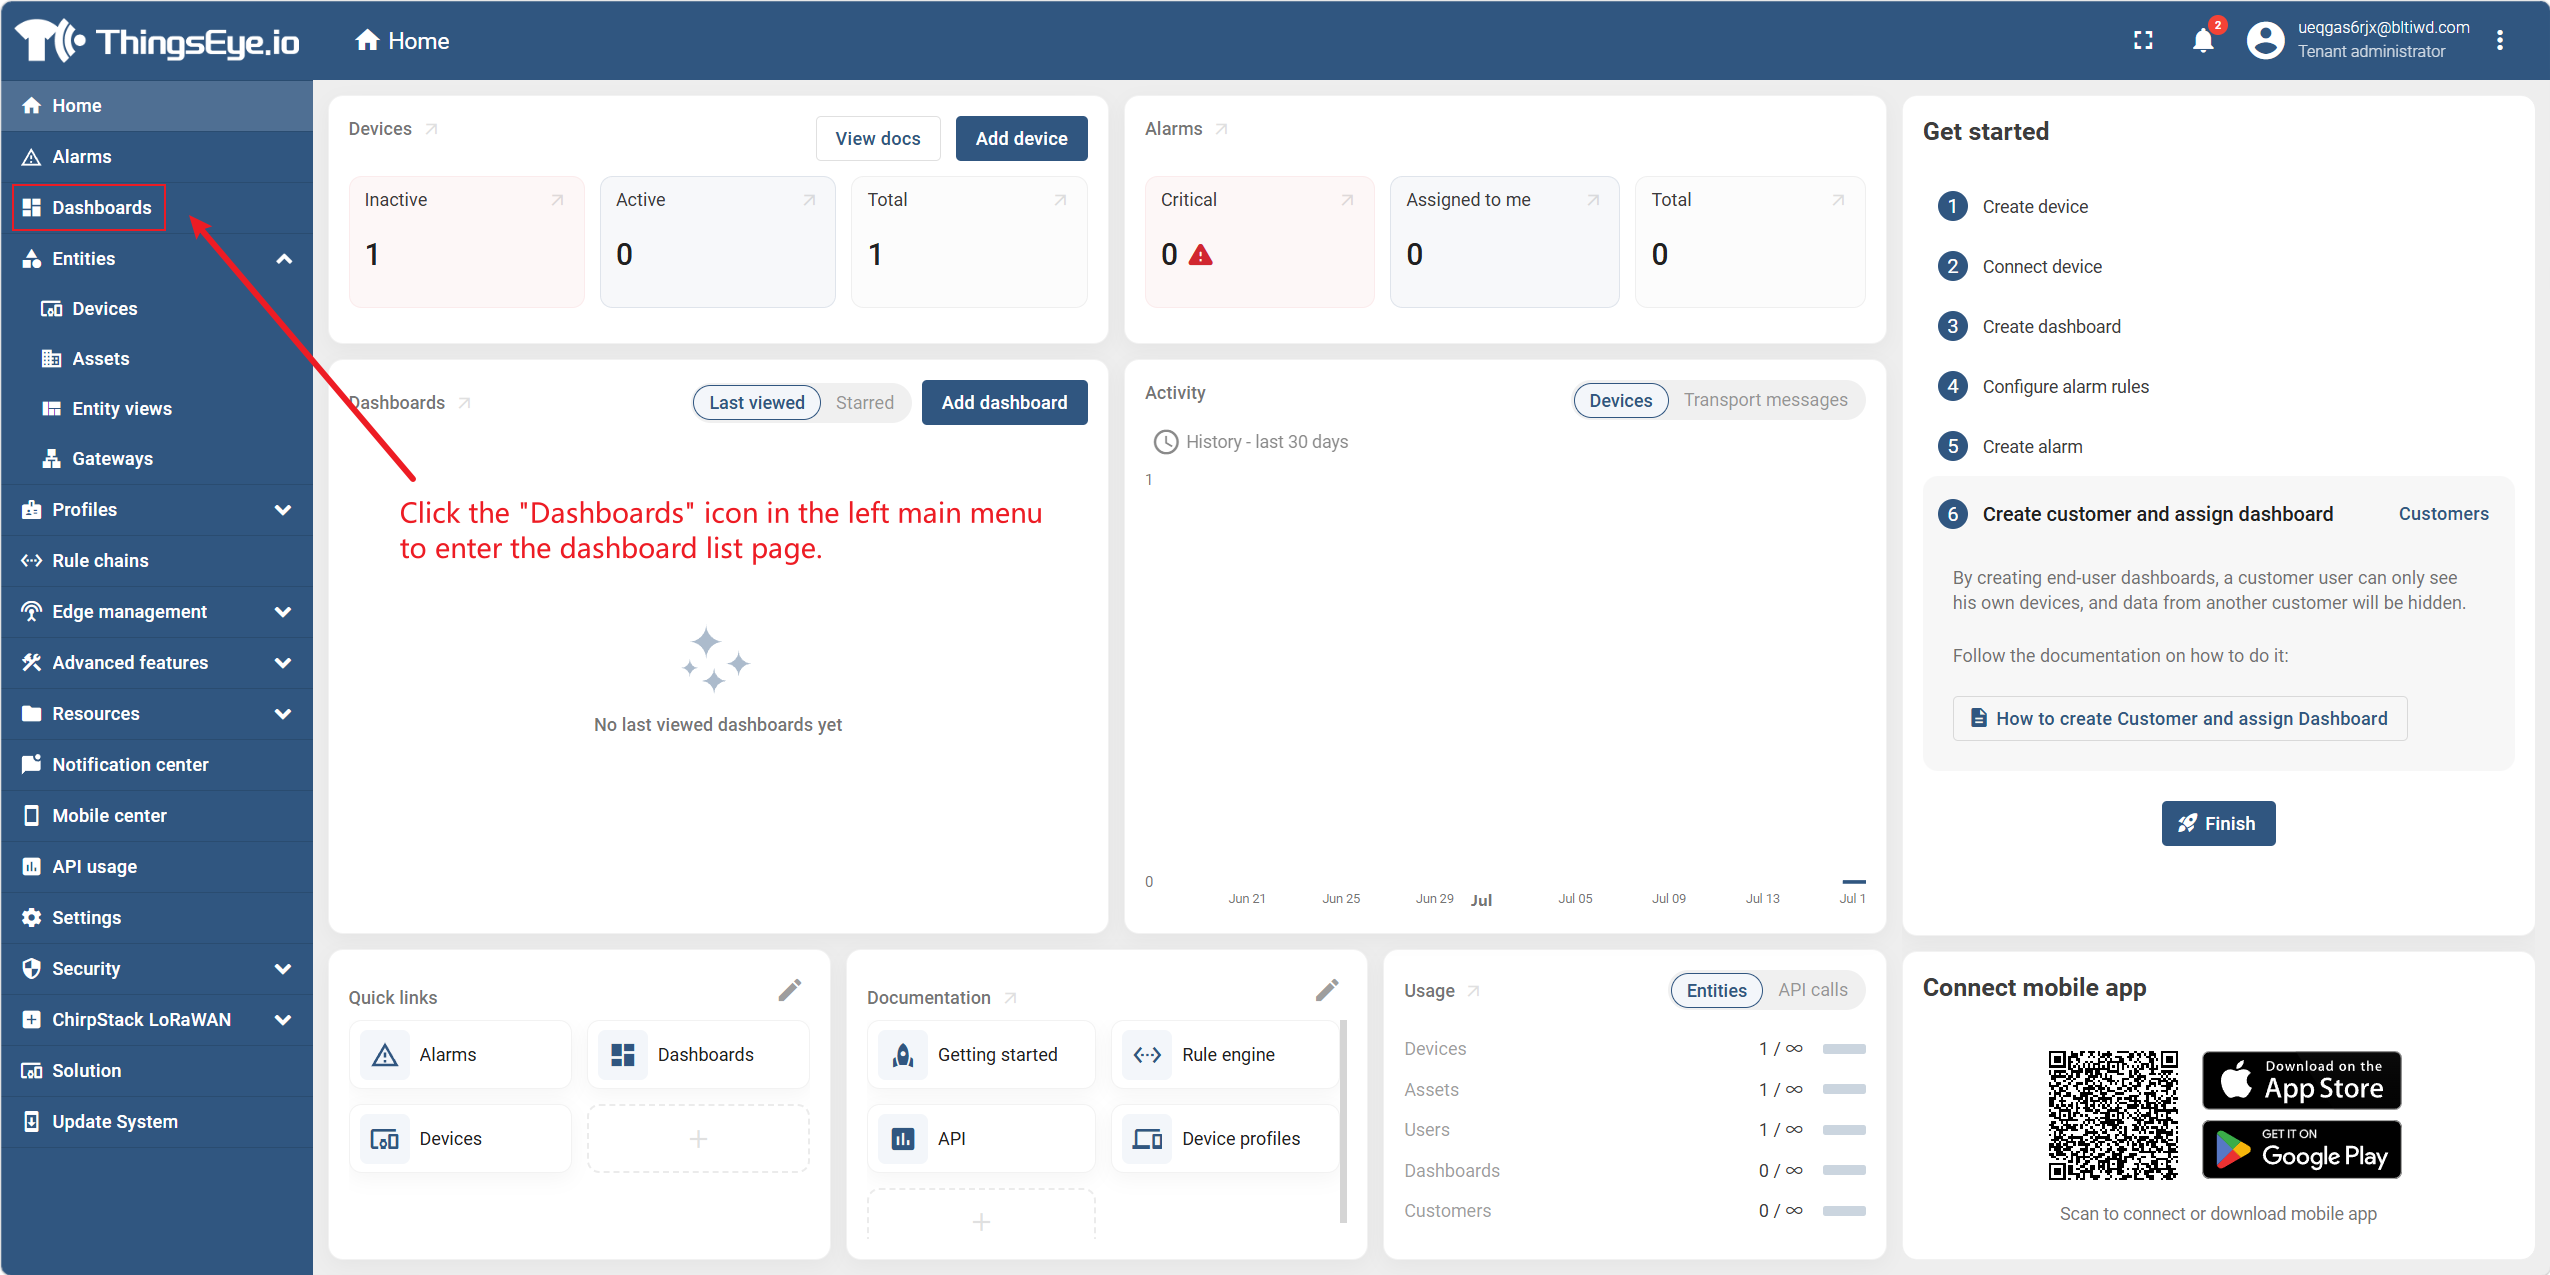
Step 1: Go to the dashboard management page
Click the "Dashboards" icon in the left main menu to go to the dashboard list page. This page displays all dashboards created under the current tenant, including draft, published, and shared dashboards.
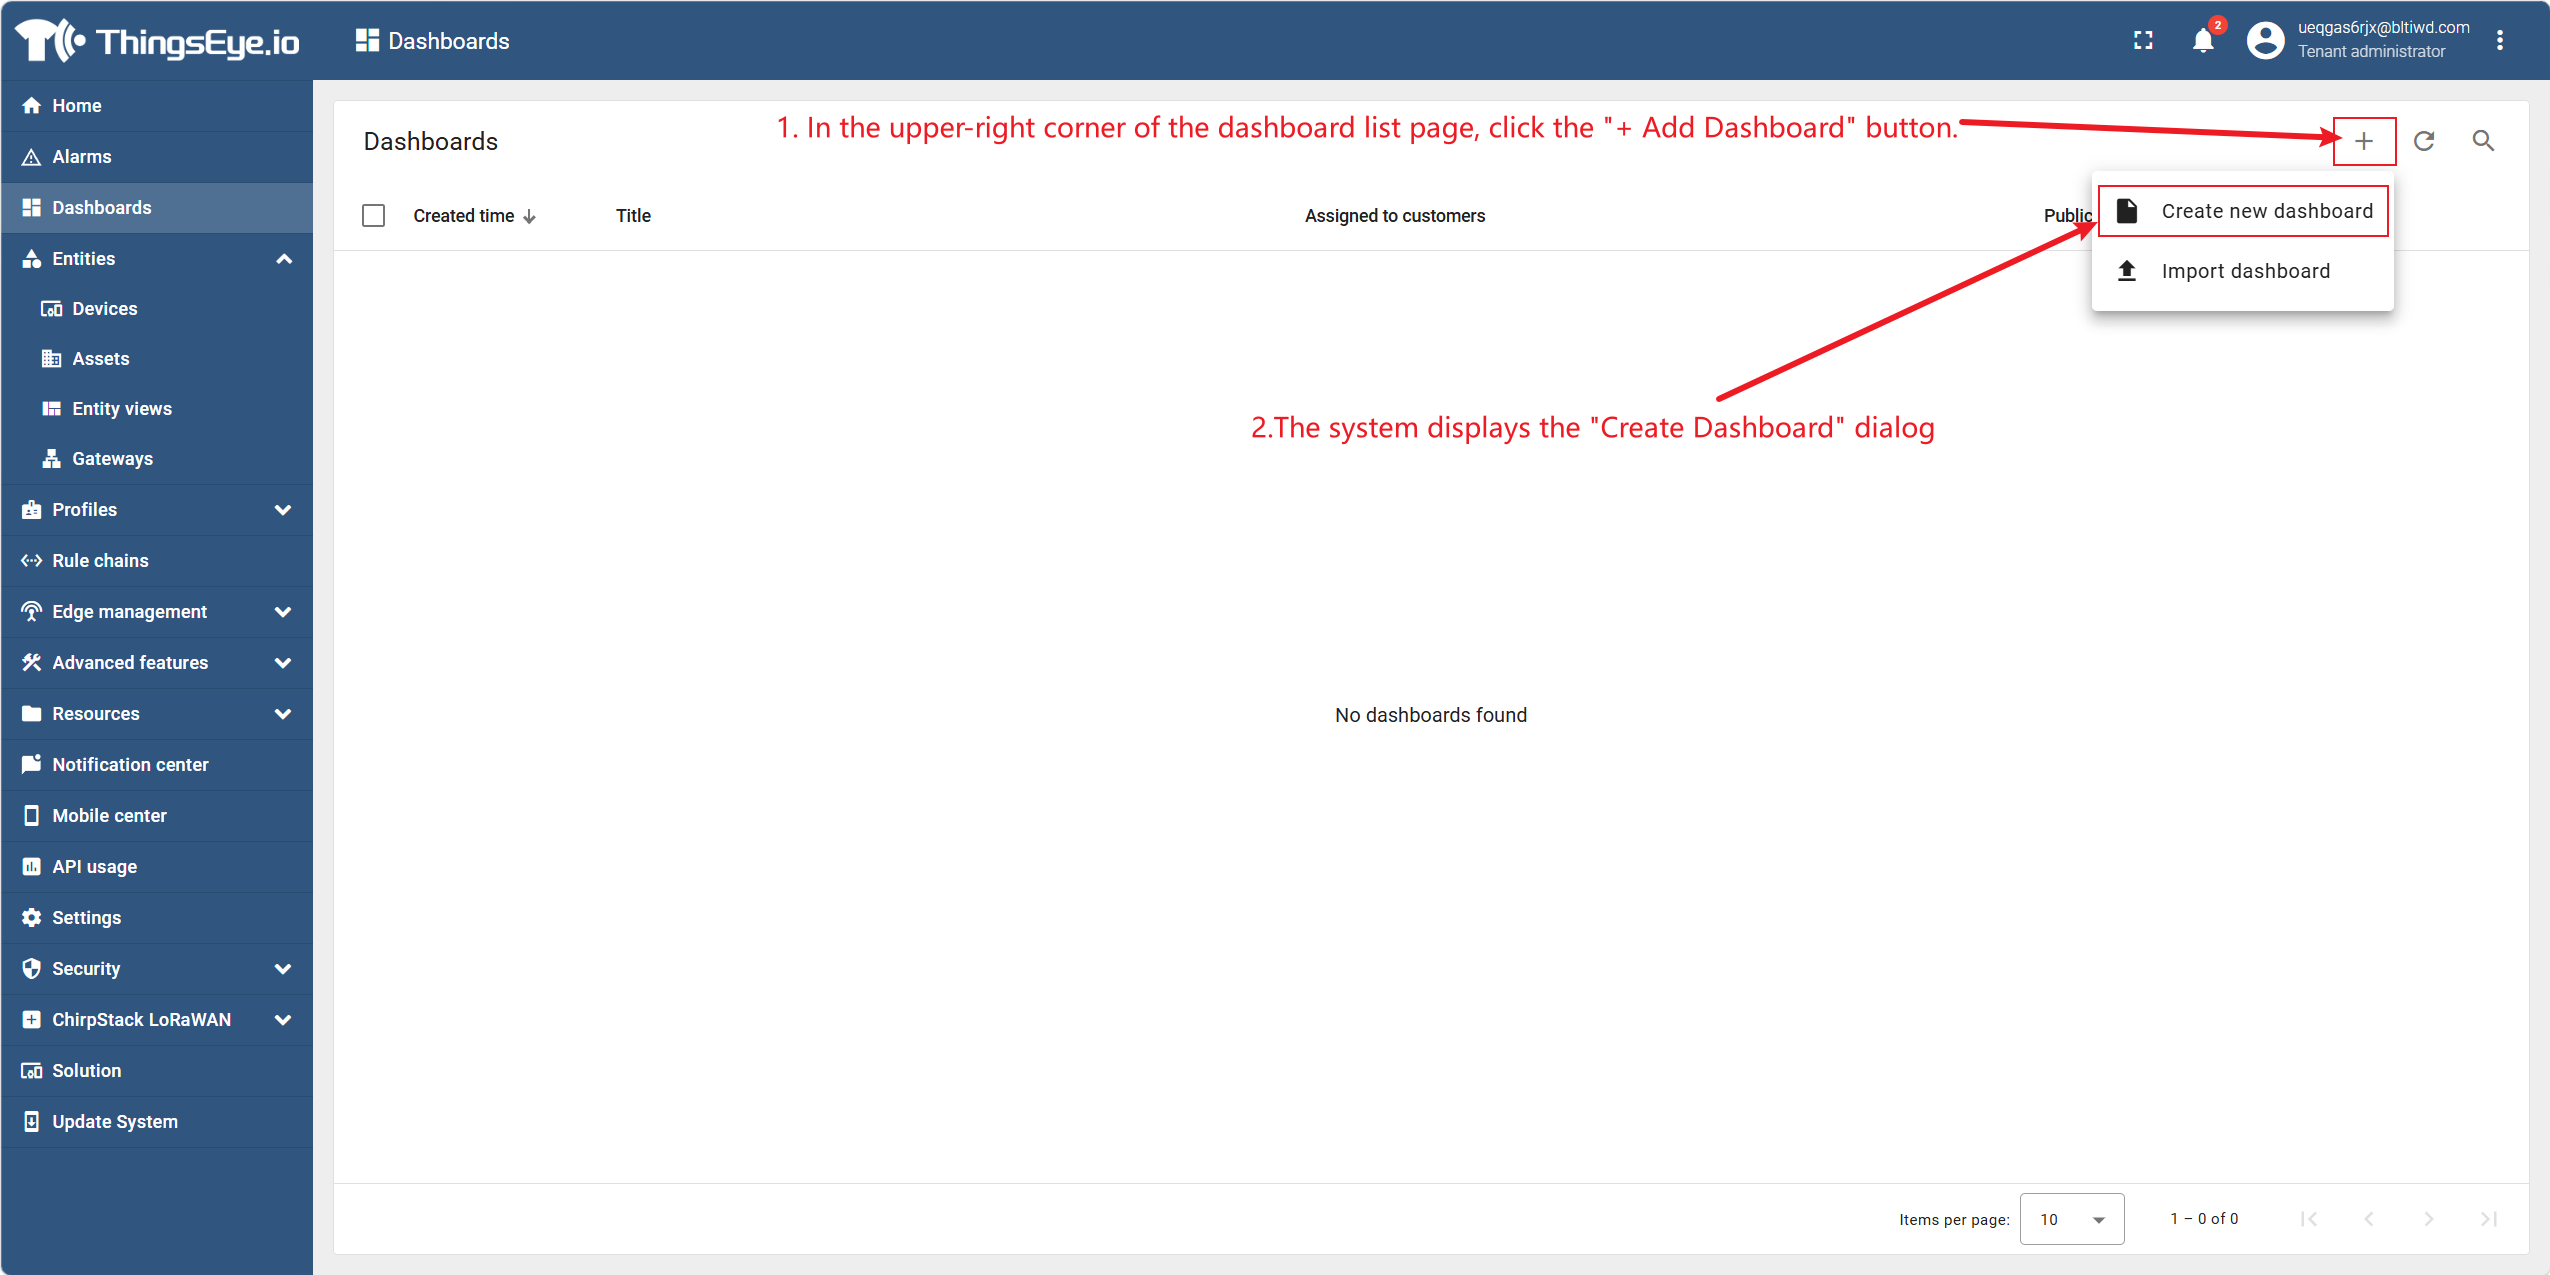
Step 2: Click to create a new dashboard
In the upper‑right corner of the dashboard list page, click the "+ Add Dashboard" button. The system displays the "Create Dashboard" dialog.
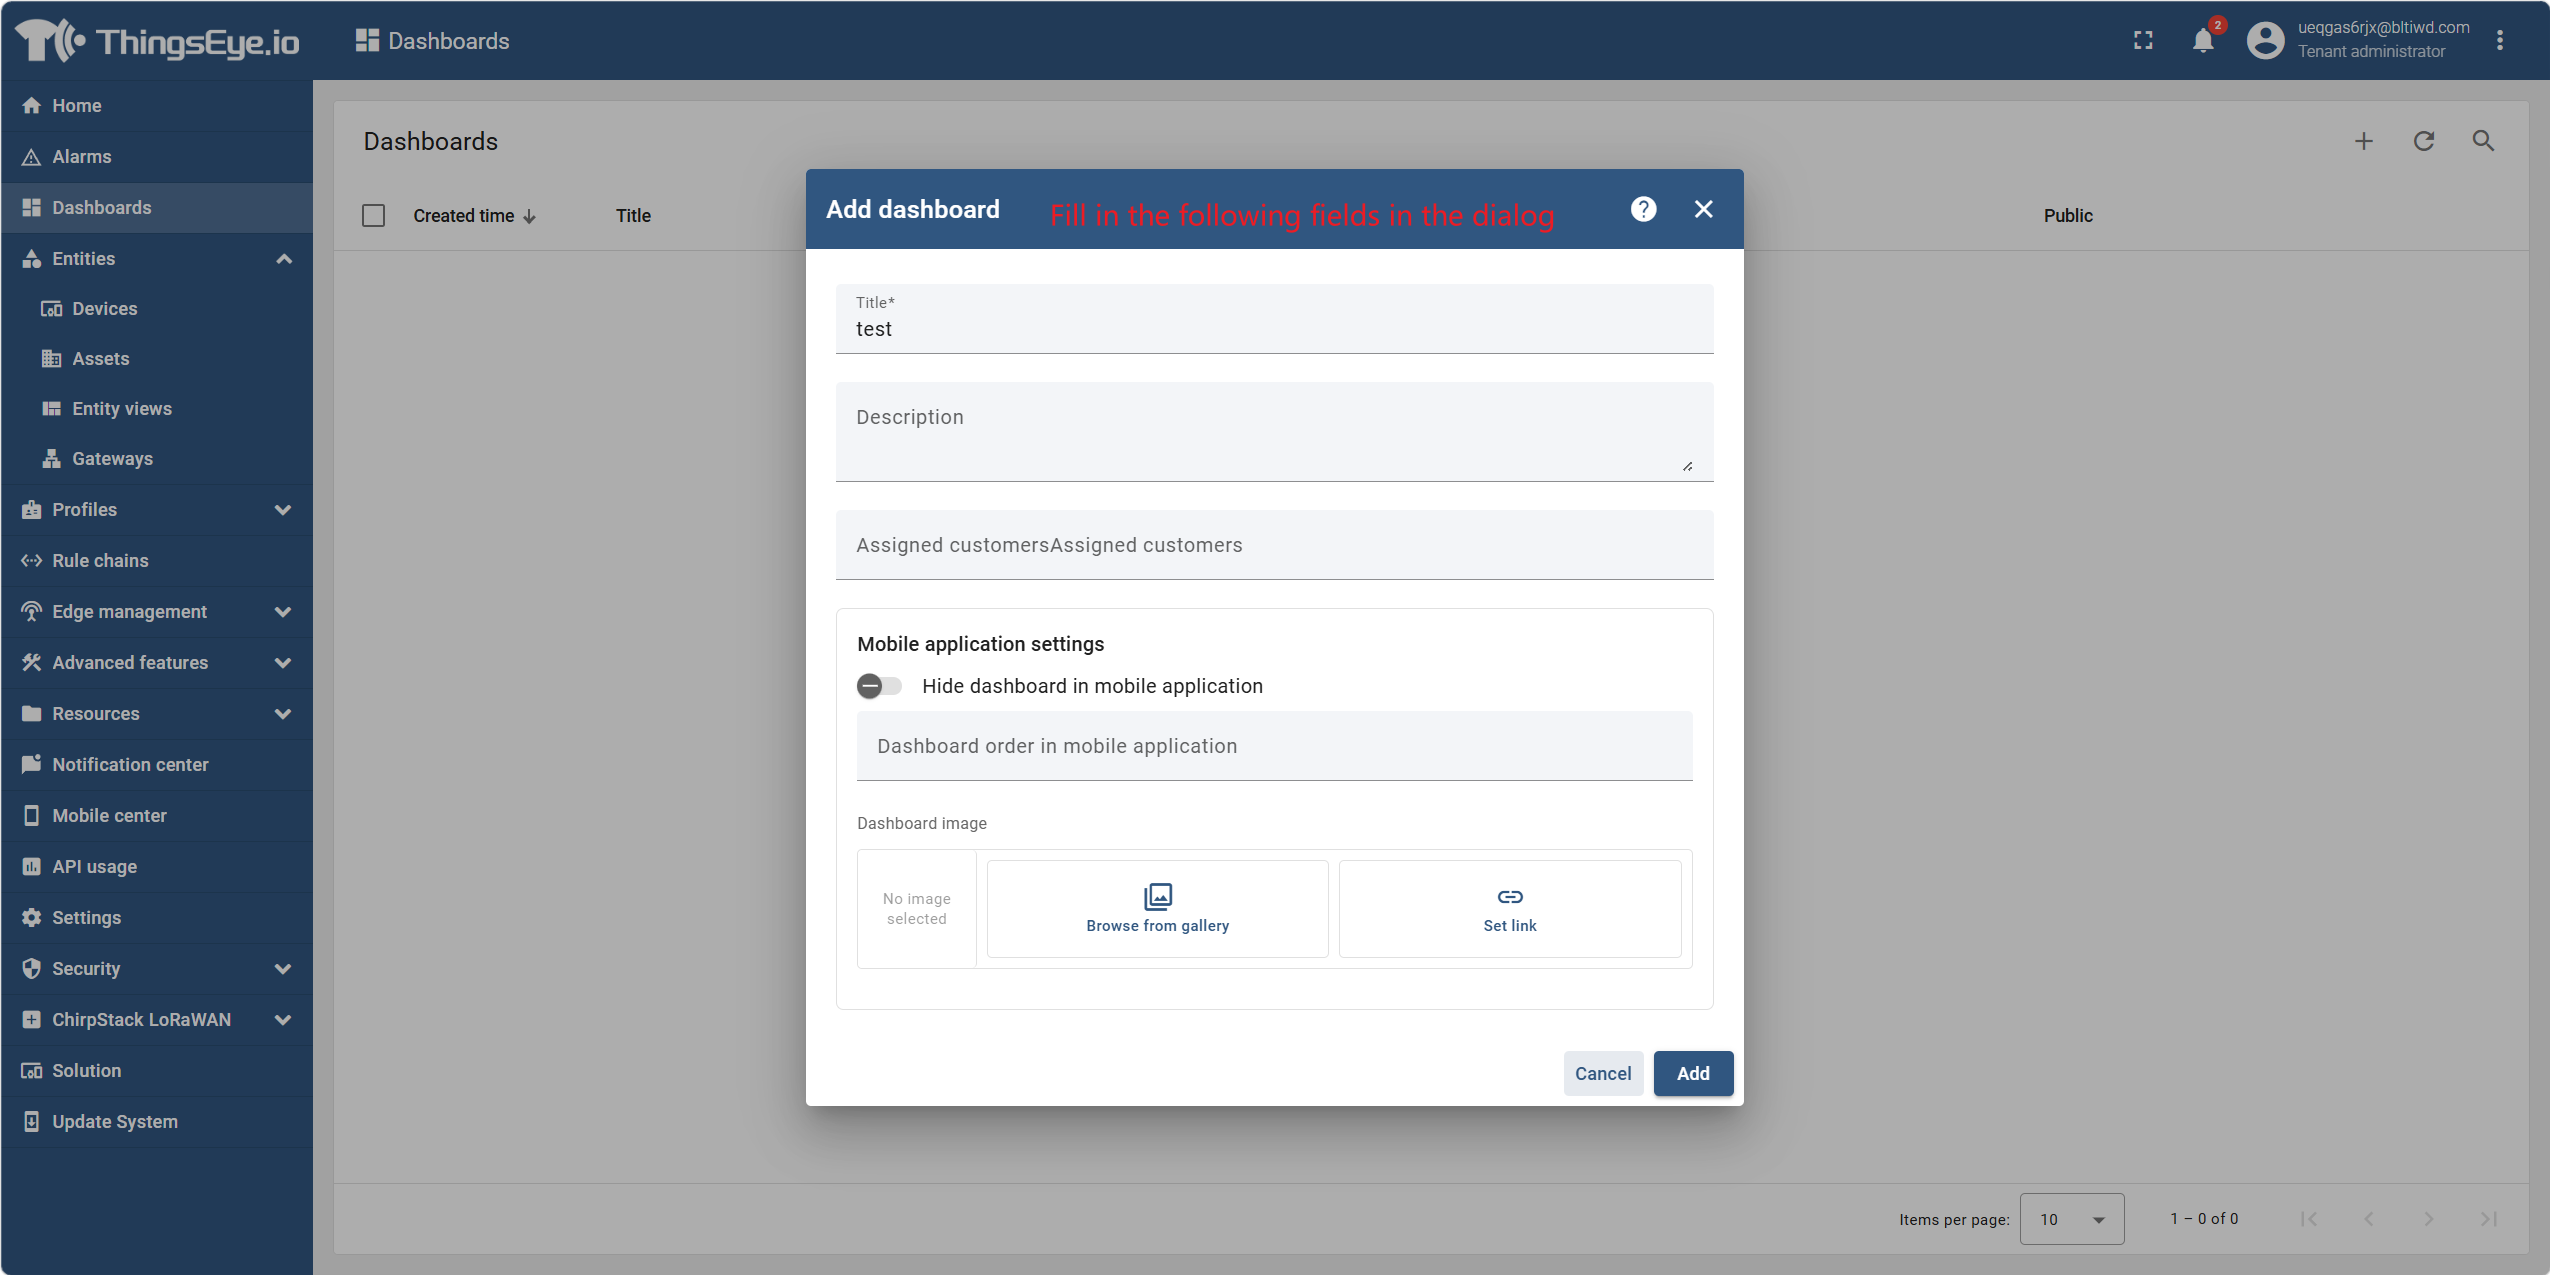
Step 3: Fill in basic dashboard properties
Fill in the following fields in the dialog:
| Field | Description | Required |
|---|---|---|
| Title | The display name of the dashboard; it is recommended to use a name that reflects its purpose or business scenario | Yes |
| Description | Additional information to help other administrators or users understand the dashboard | No |
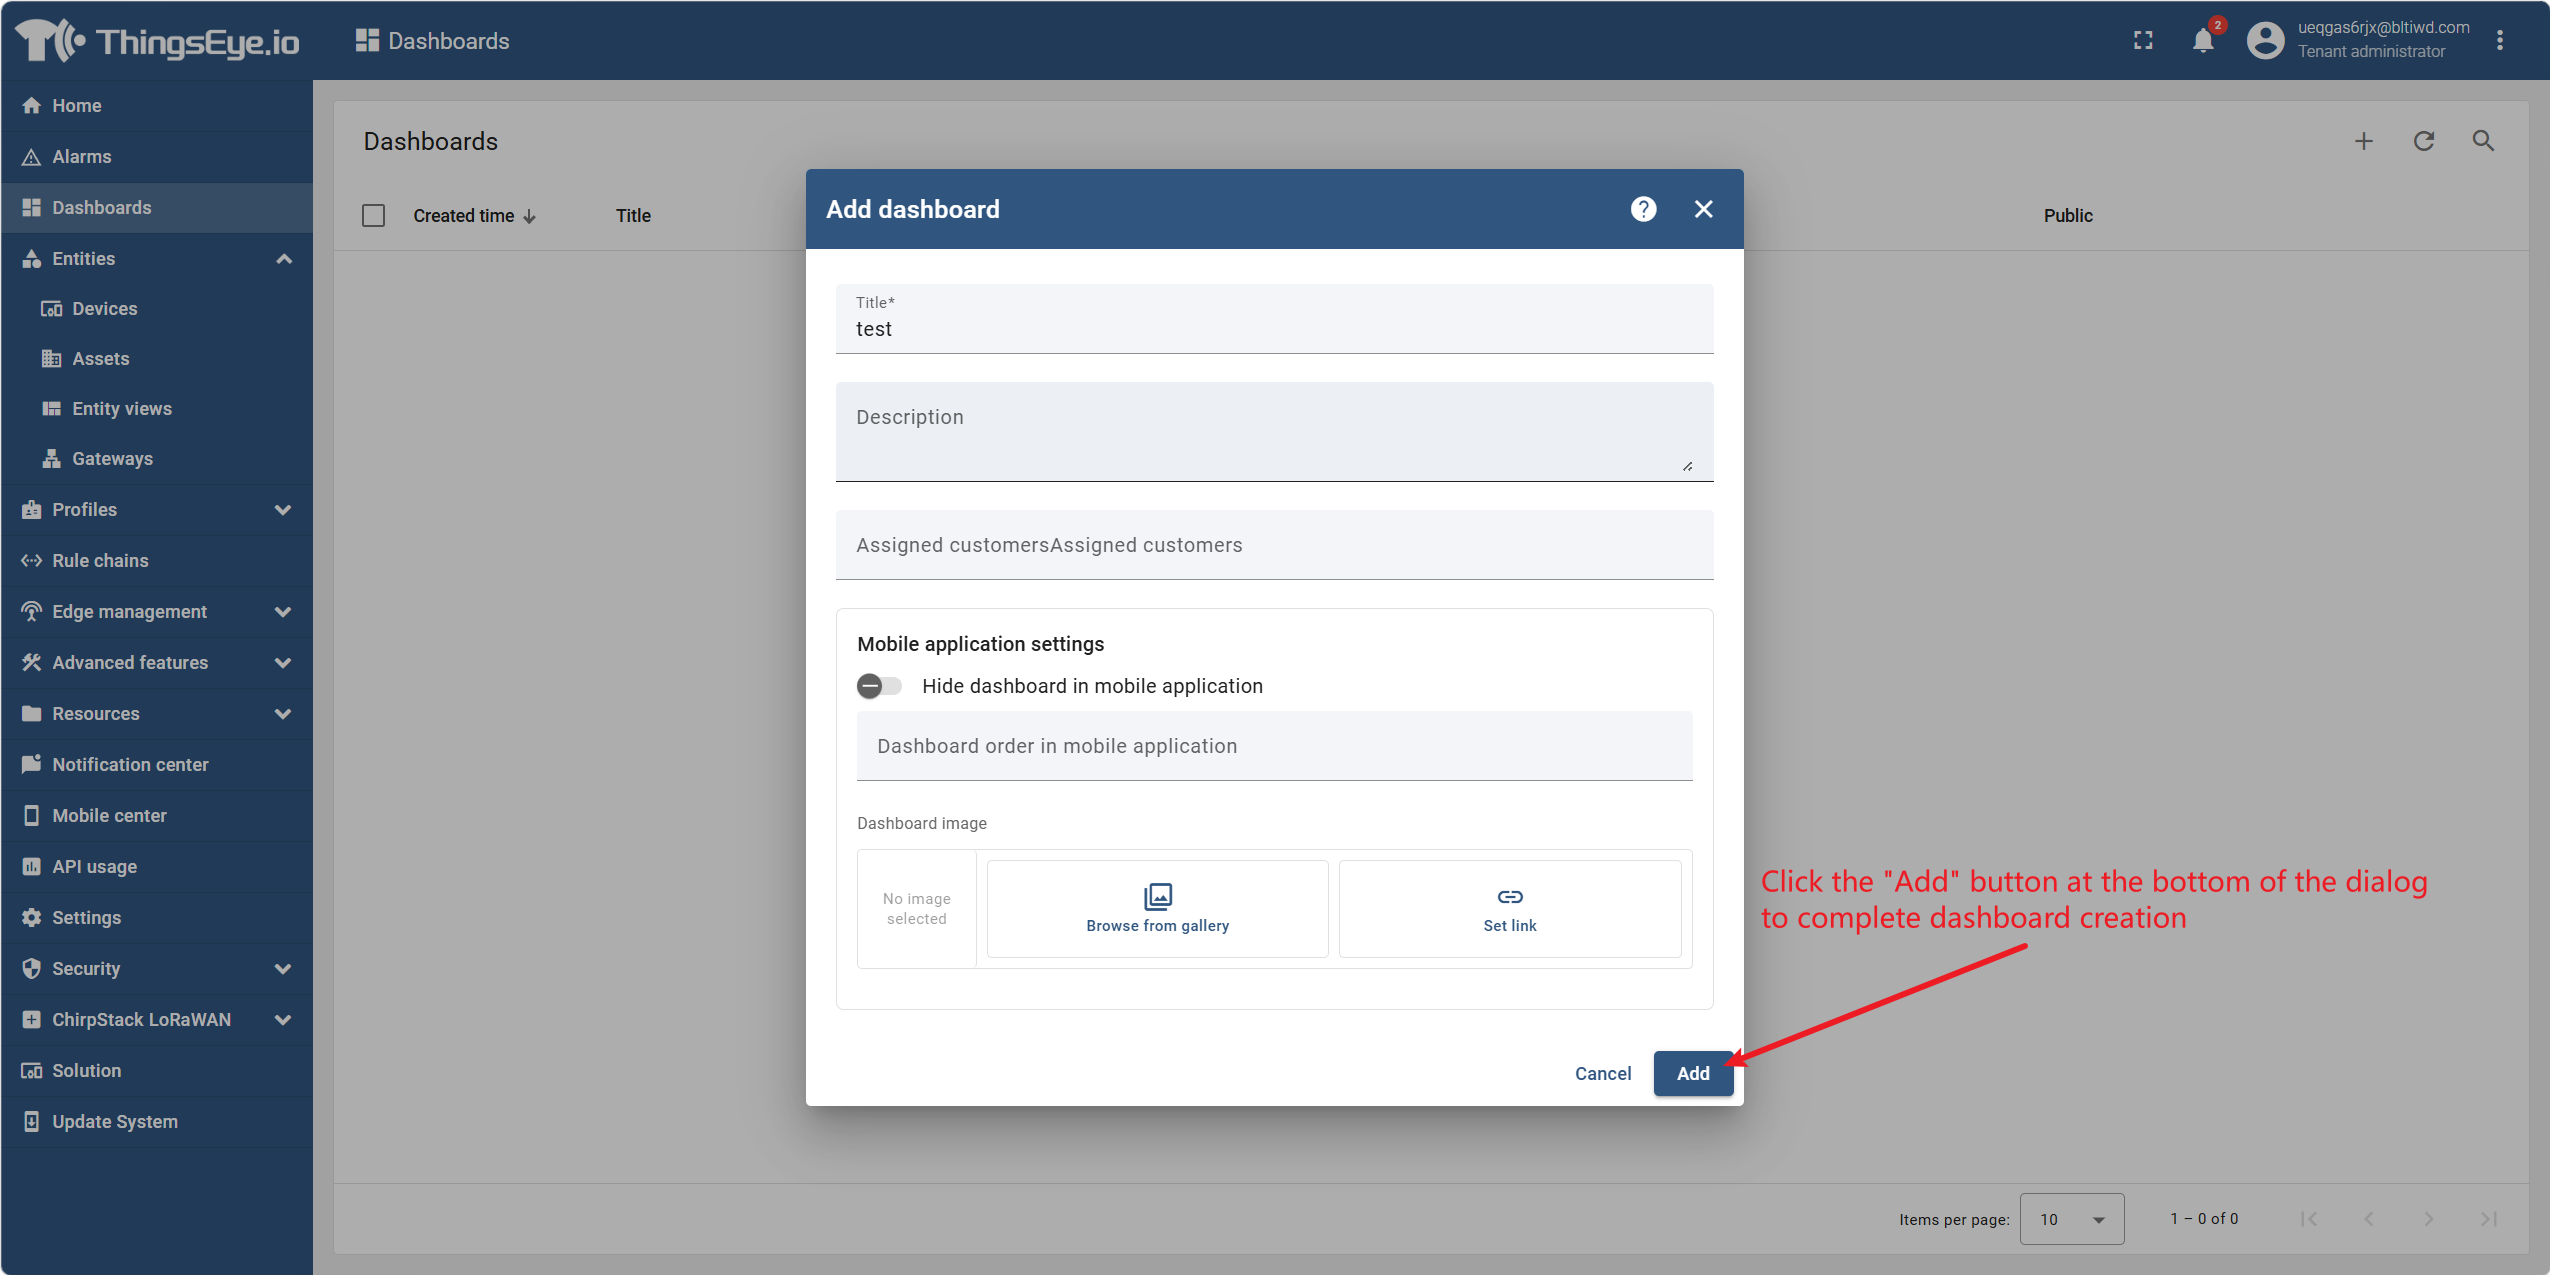
Step 4: Add the dashboard
Click the "Add" button at the bottom of the dialog to complete the dashboard creation.
After successful creation, the page automatically navigates to the newly created dashboard's editing interface (saved as a draft by default). In this interface, you can add widgets, adjust the layout, and configure data sources.
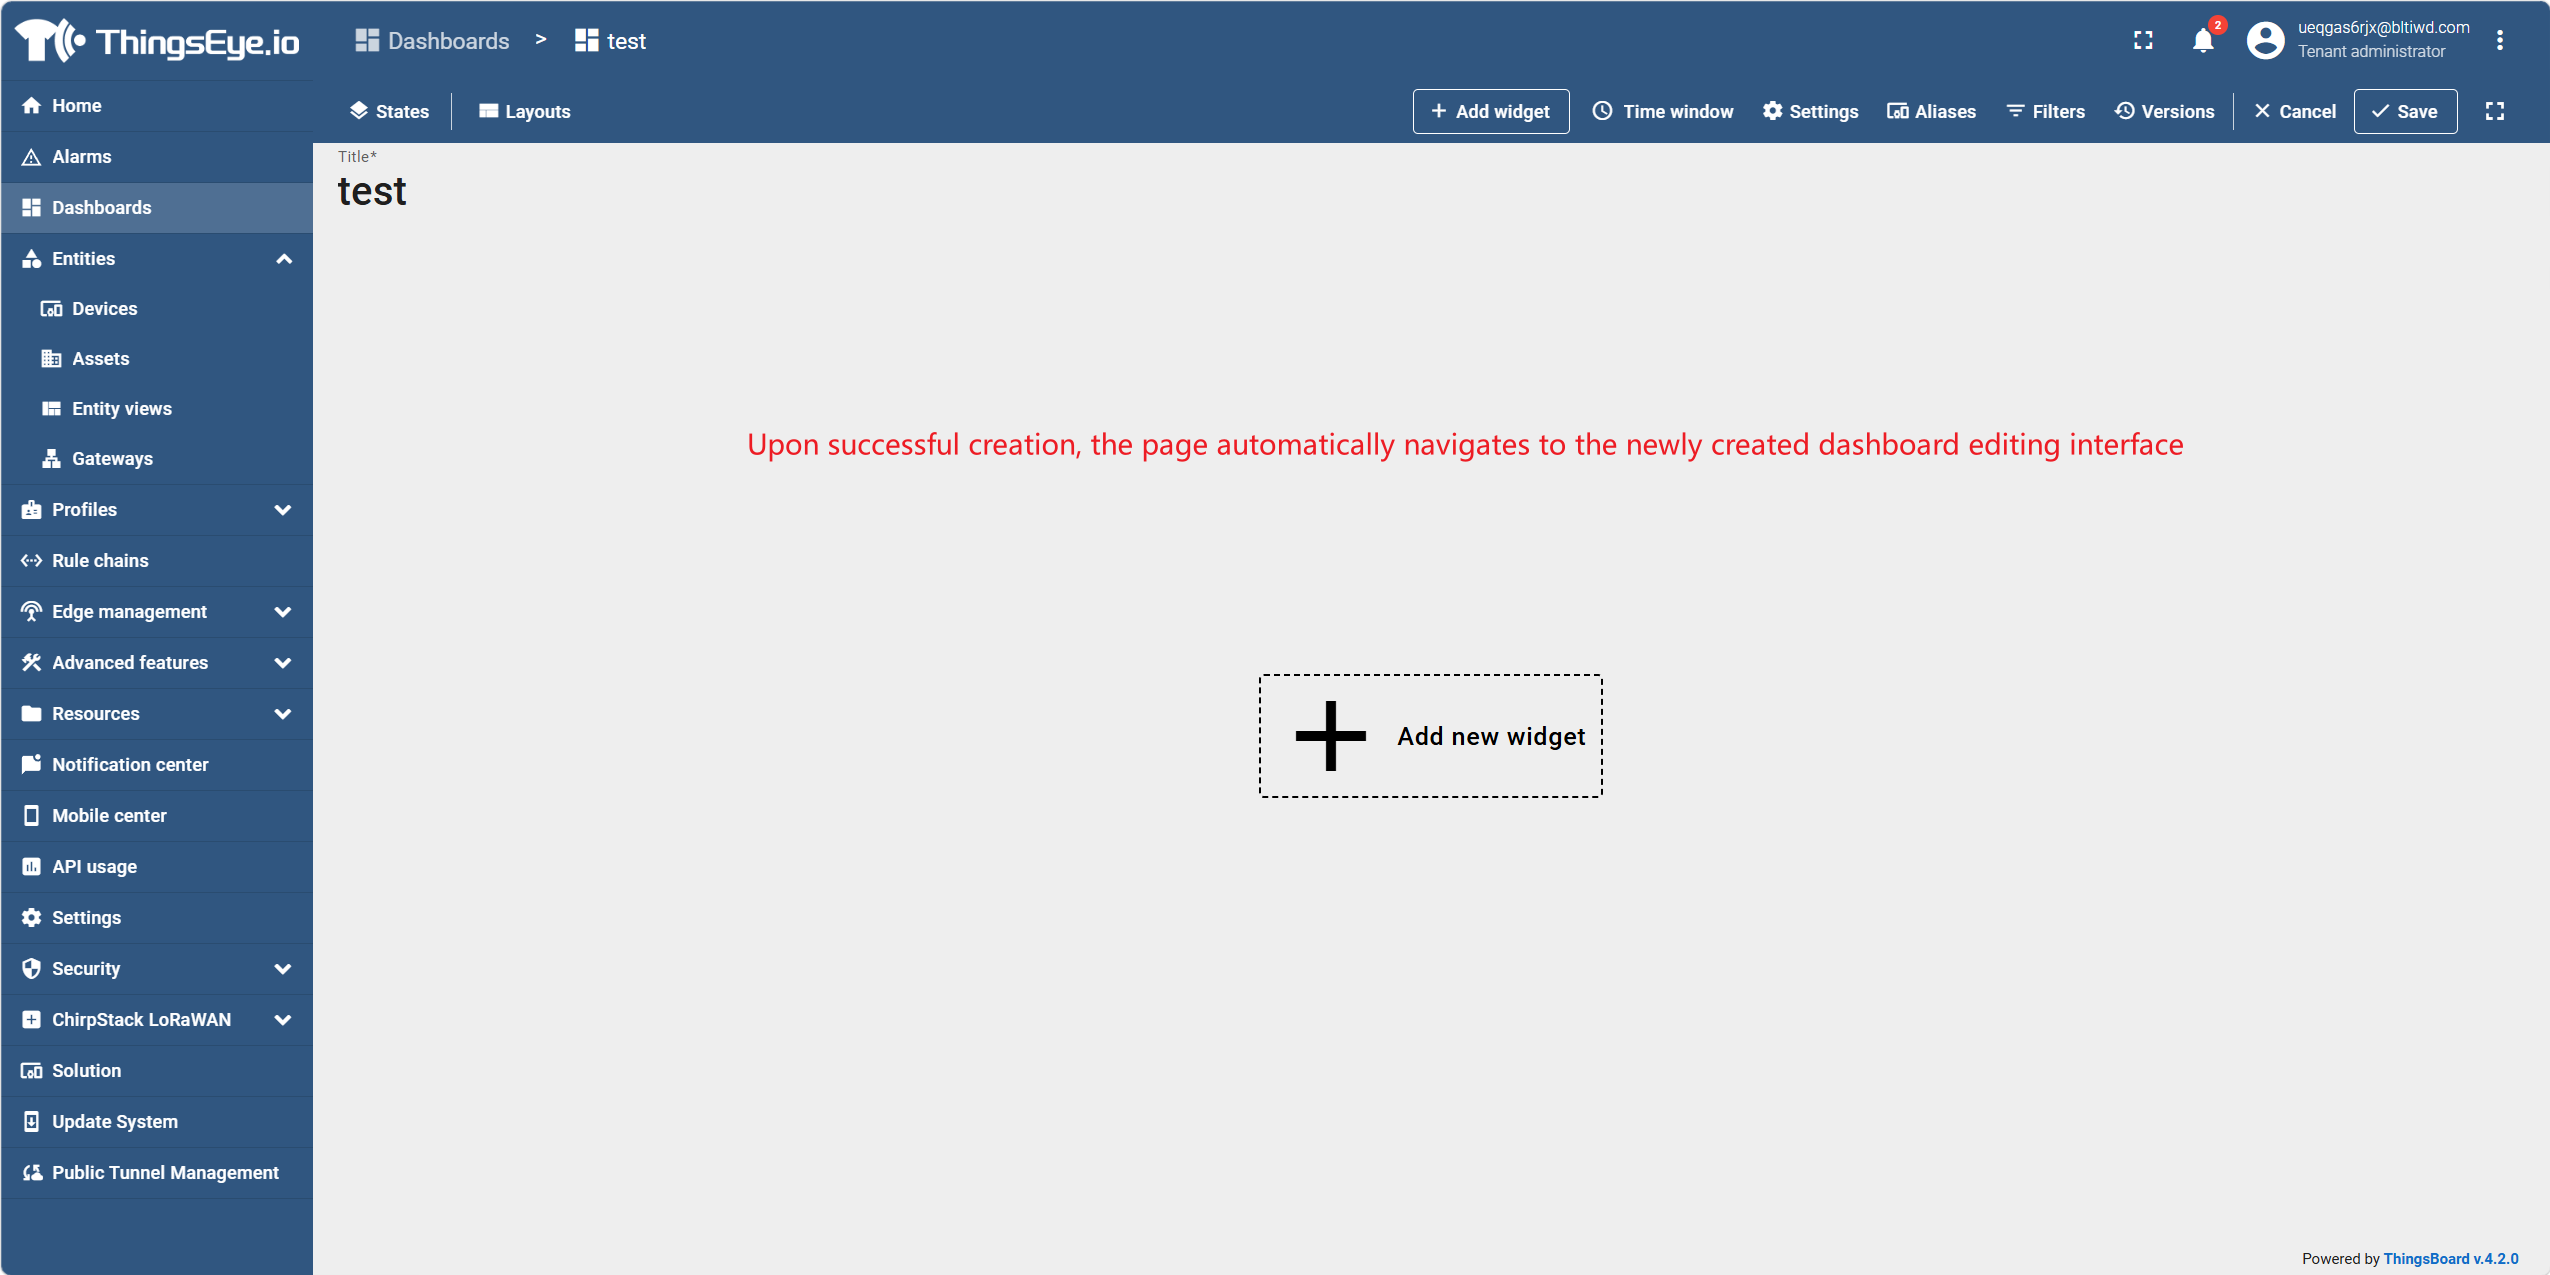
If you click "Save & Publish", the dashboard will be published directly as available. However, it is recommended to complete widget configuration in draft state first before publishing.
2. Add Widgets
Procedure
Step 1: Enter edit mode
On the dashboard list page, click the target dashboard card to go to the view interface. If the dashboard is in draft state, the system defaults to edit mode; if it is in published state, click the "Edit Mode" button in the upper‑right corner of the interface to switch to edit mode.
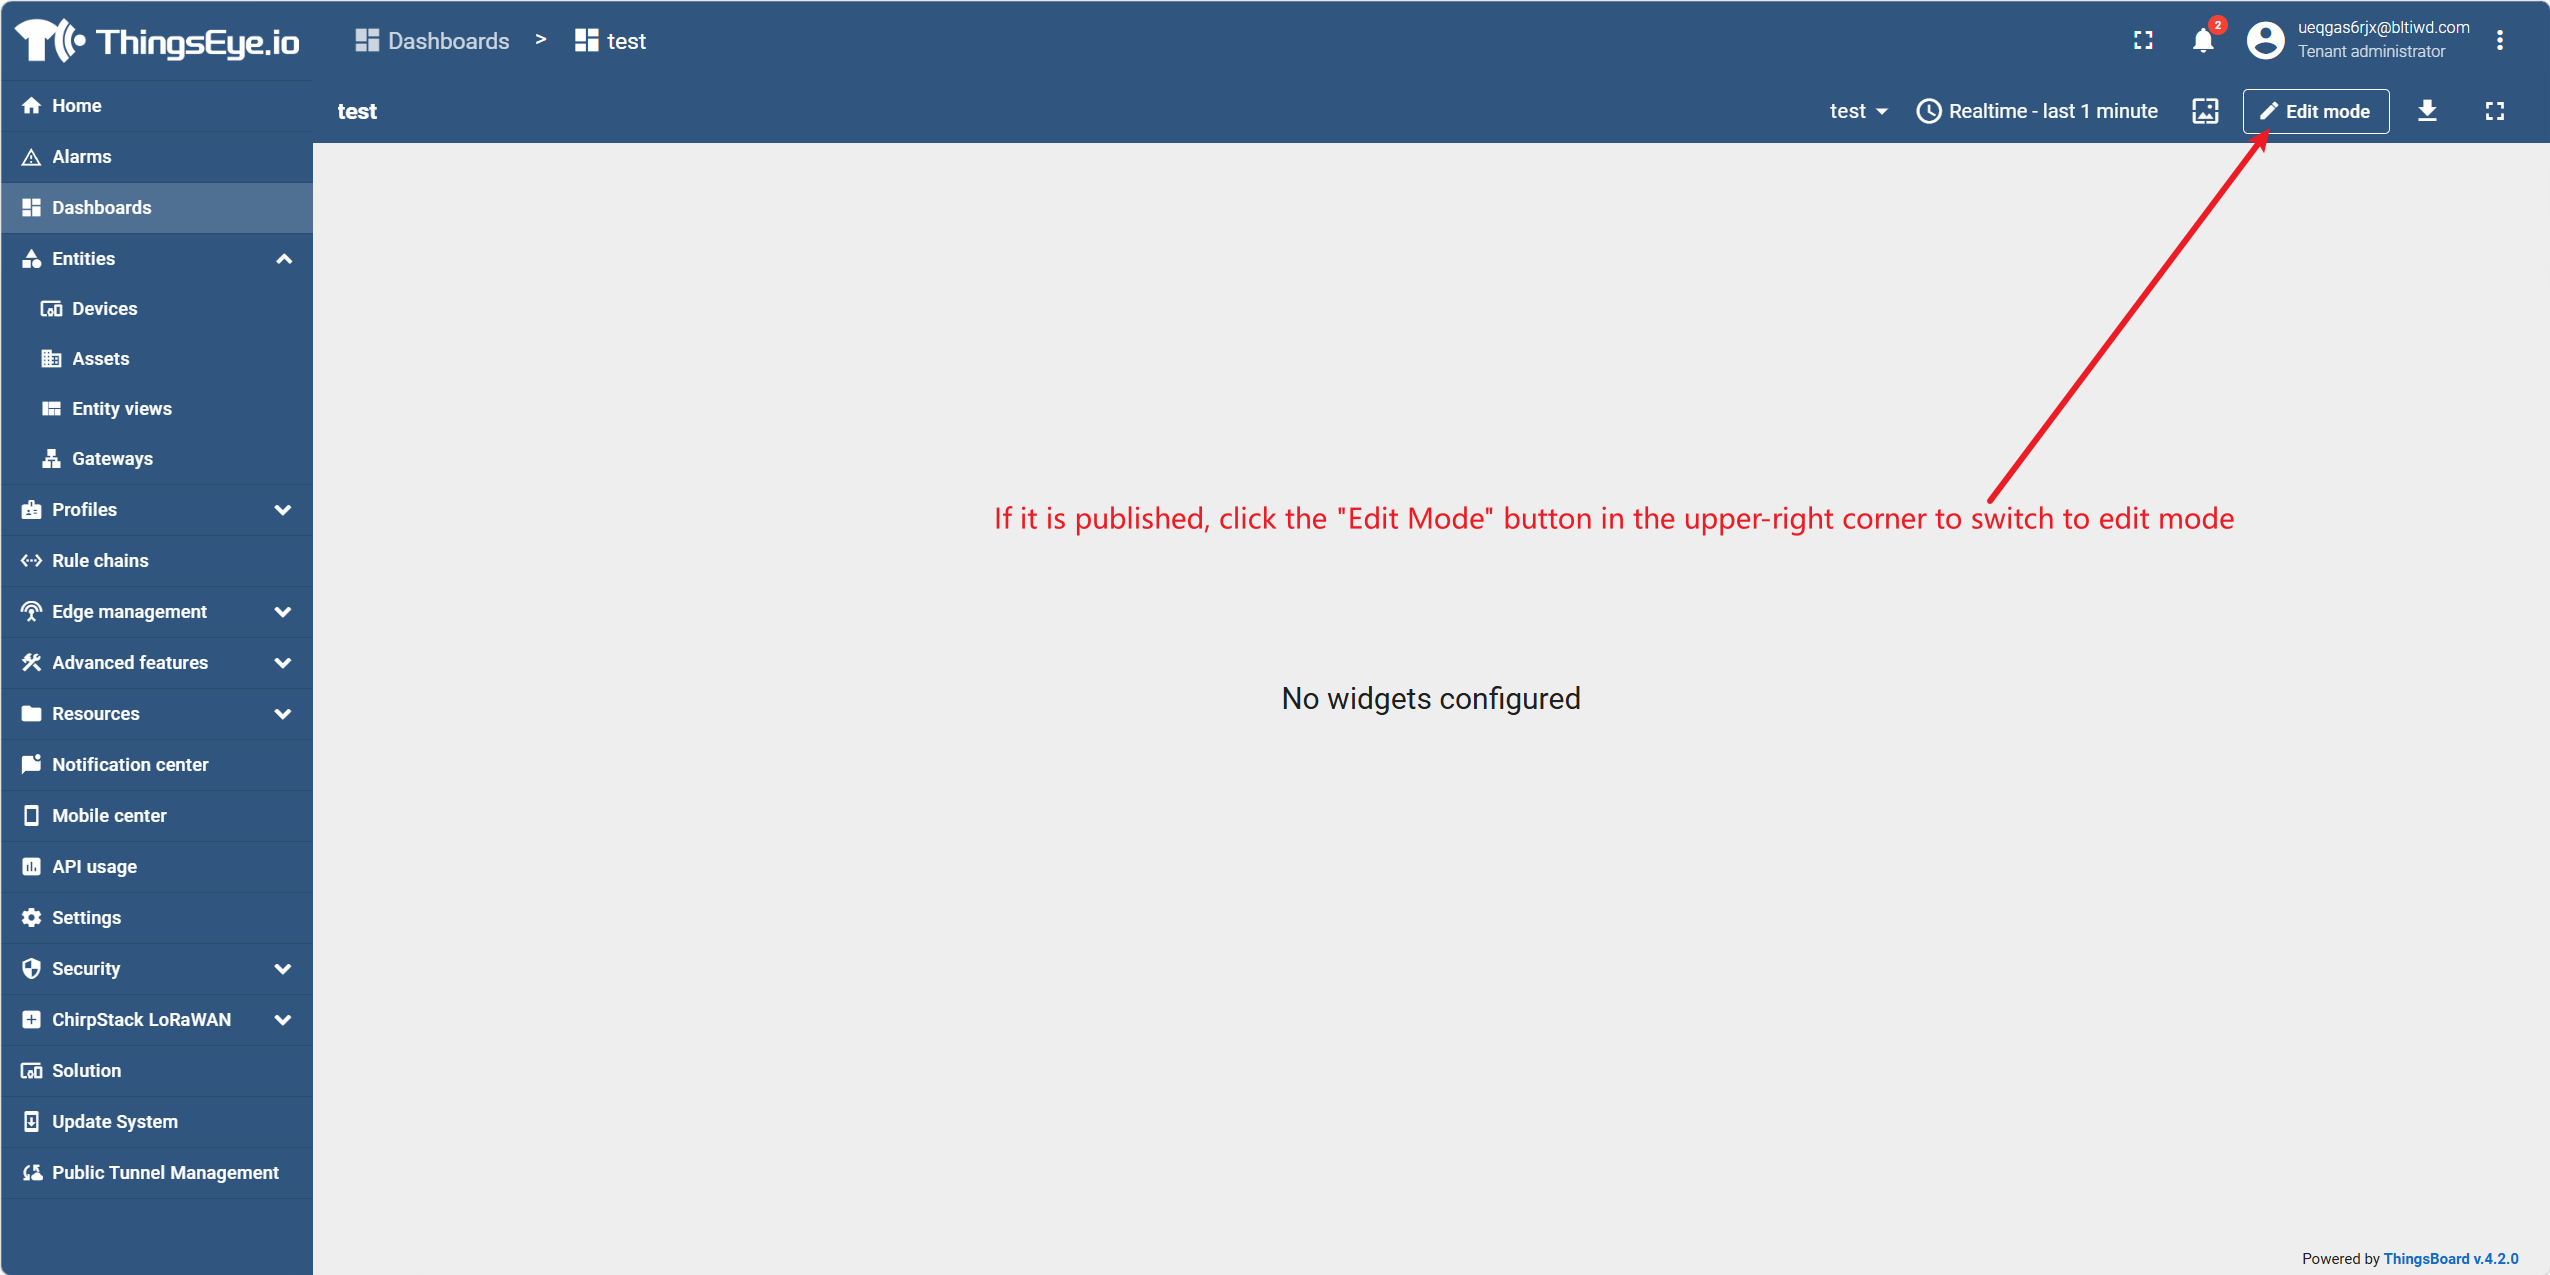
In edit mode, a toolbar is displayed at the top of the interface, containing action buttons such as Add Widget, Save, Cancel, etc.
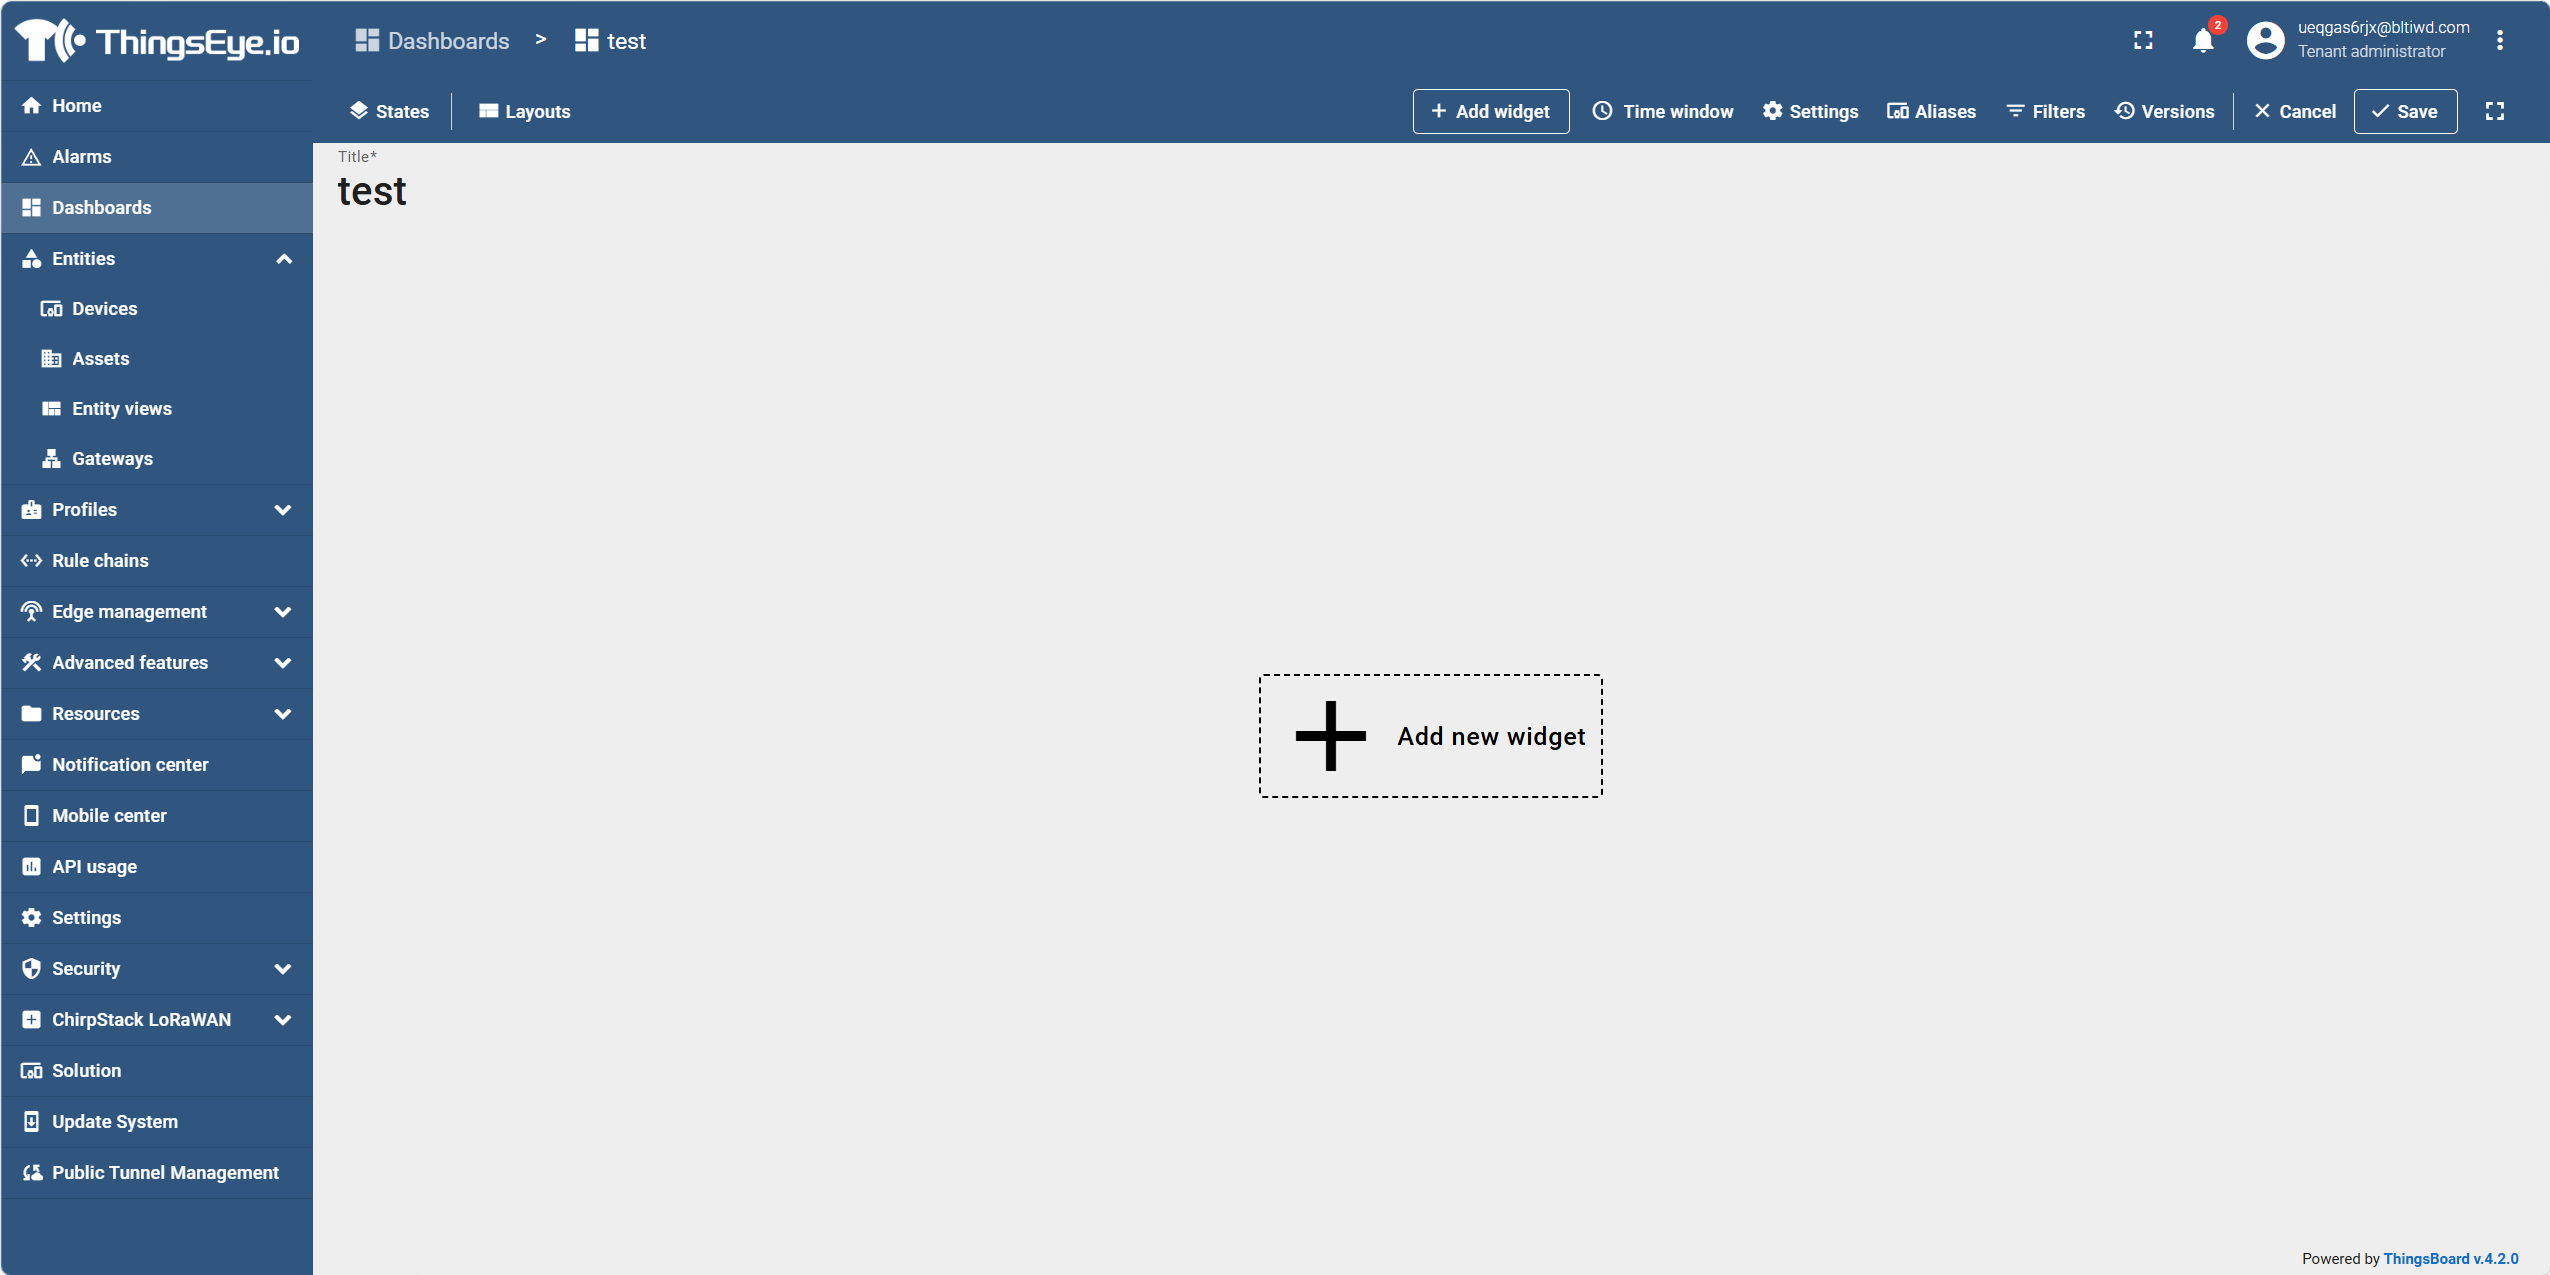
Step 2: Click to add a widget
In edit mode, perform either of the following actions:
- Click the "+ Add Widget" button at the top of the interface; or
- If the dashboard currently has no widgets, click the large "Add New Widget" button in the center of the interface.
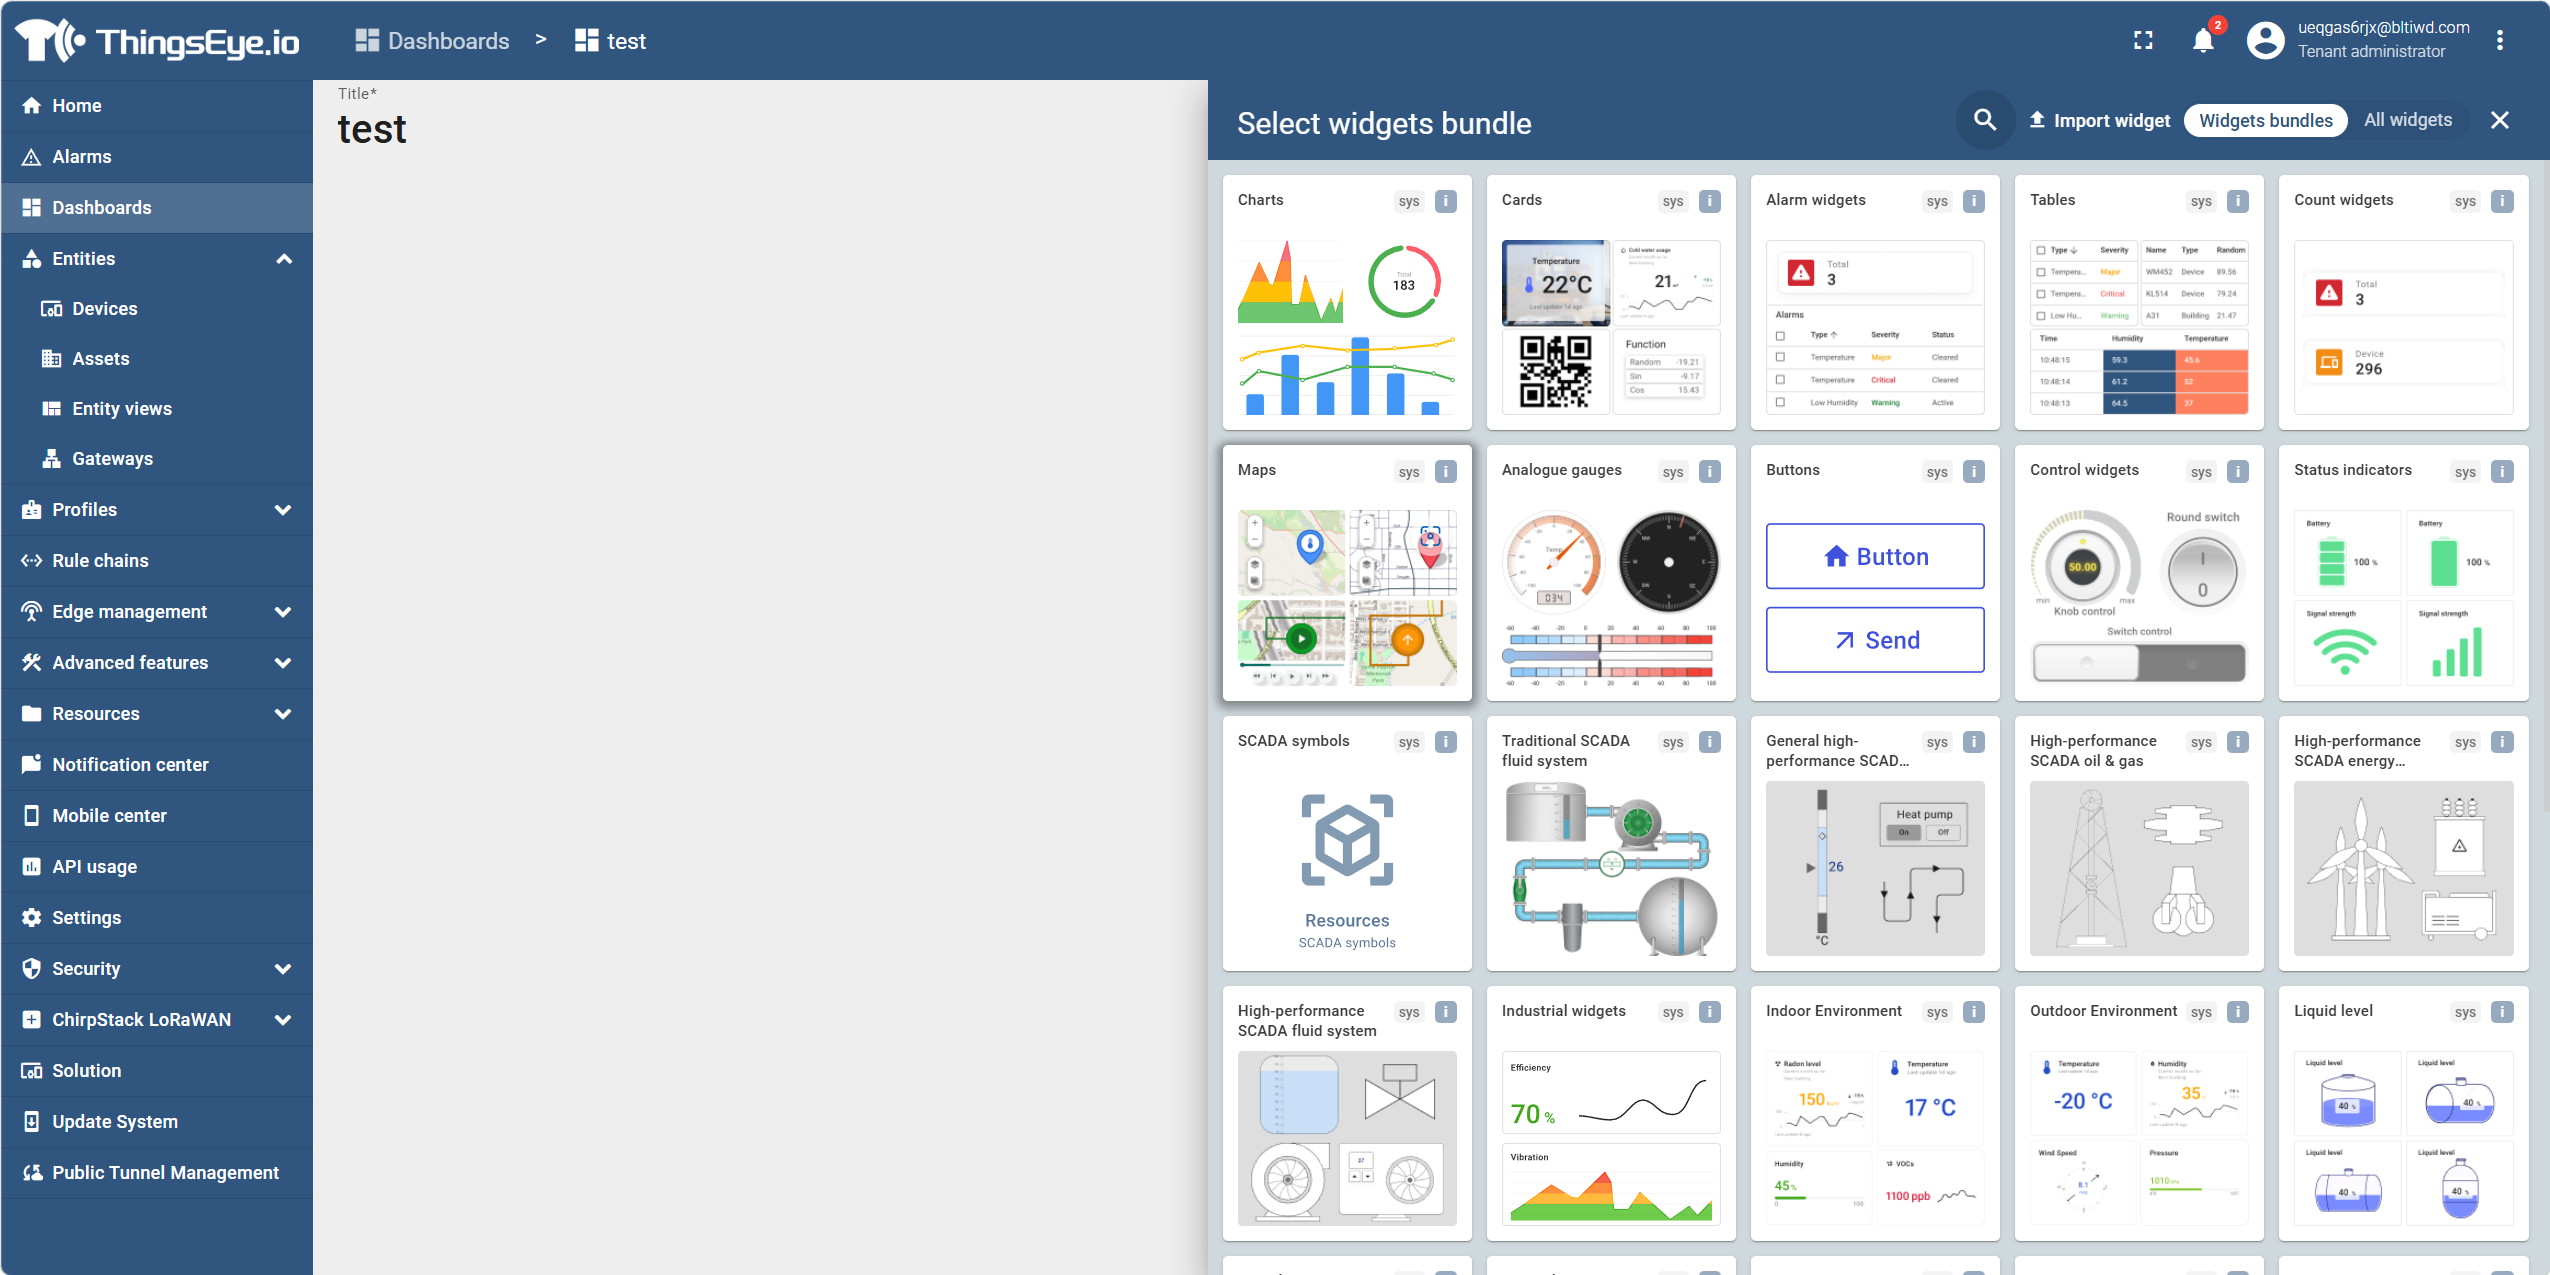
The system displays the "Widget Bundle" selection dialog.
Step 3: Select widget bundle and widget type
In the dialog, select a widget bundle from the left list (e.g., Charts, Cards, Alarm widgets, etc.). Widget bundles group widgets by functionality.
Under the selected widget bundle, click the target widget (e.g., Time series chart, Value card, Alarms table, etc.) to select it. Use the magnifying glass icon and search box in the upper‑right corner to quickly find a widget.
The system displays the "Add Widget" configuration dialog.
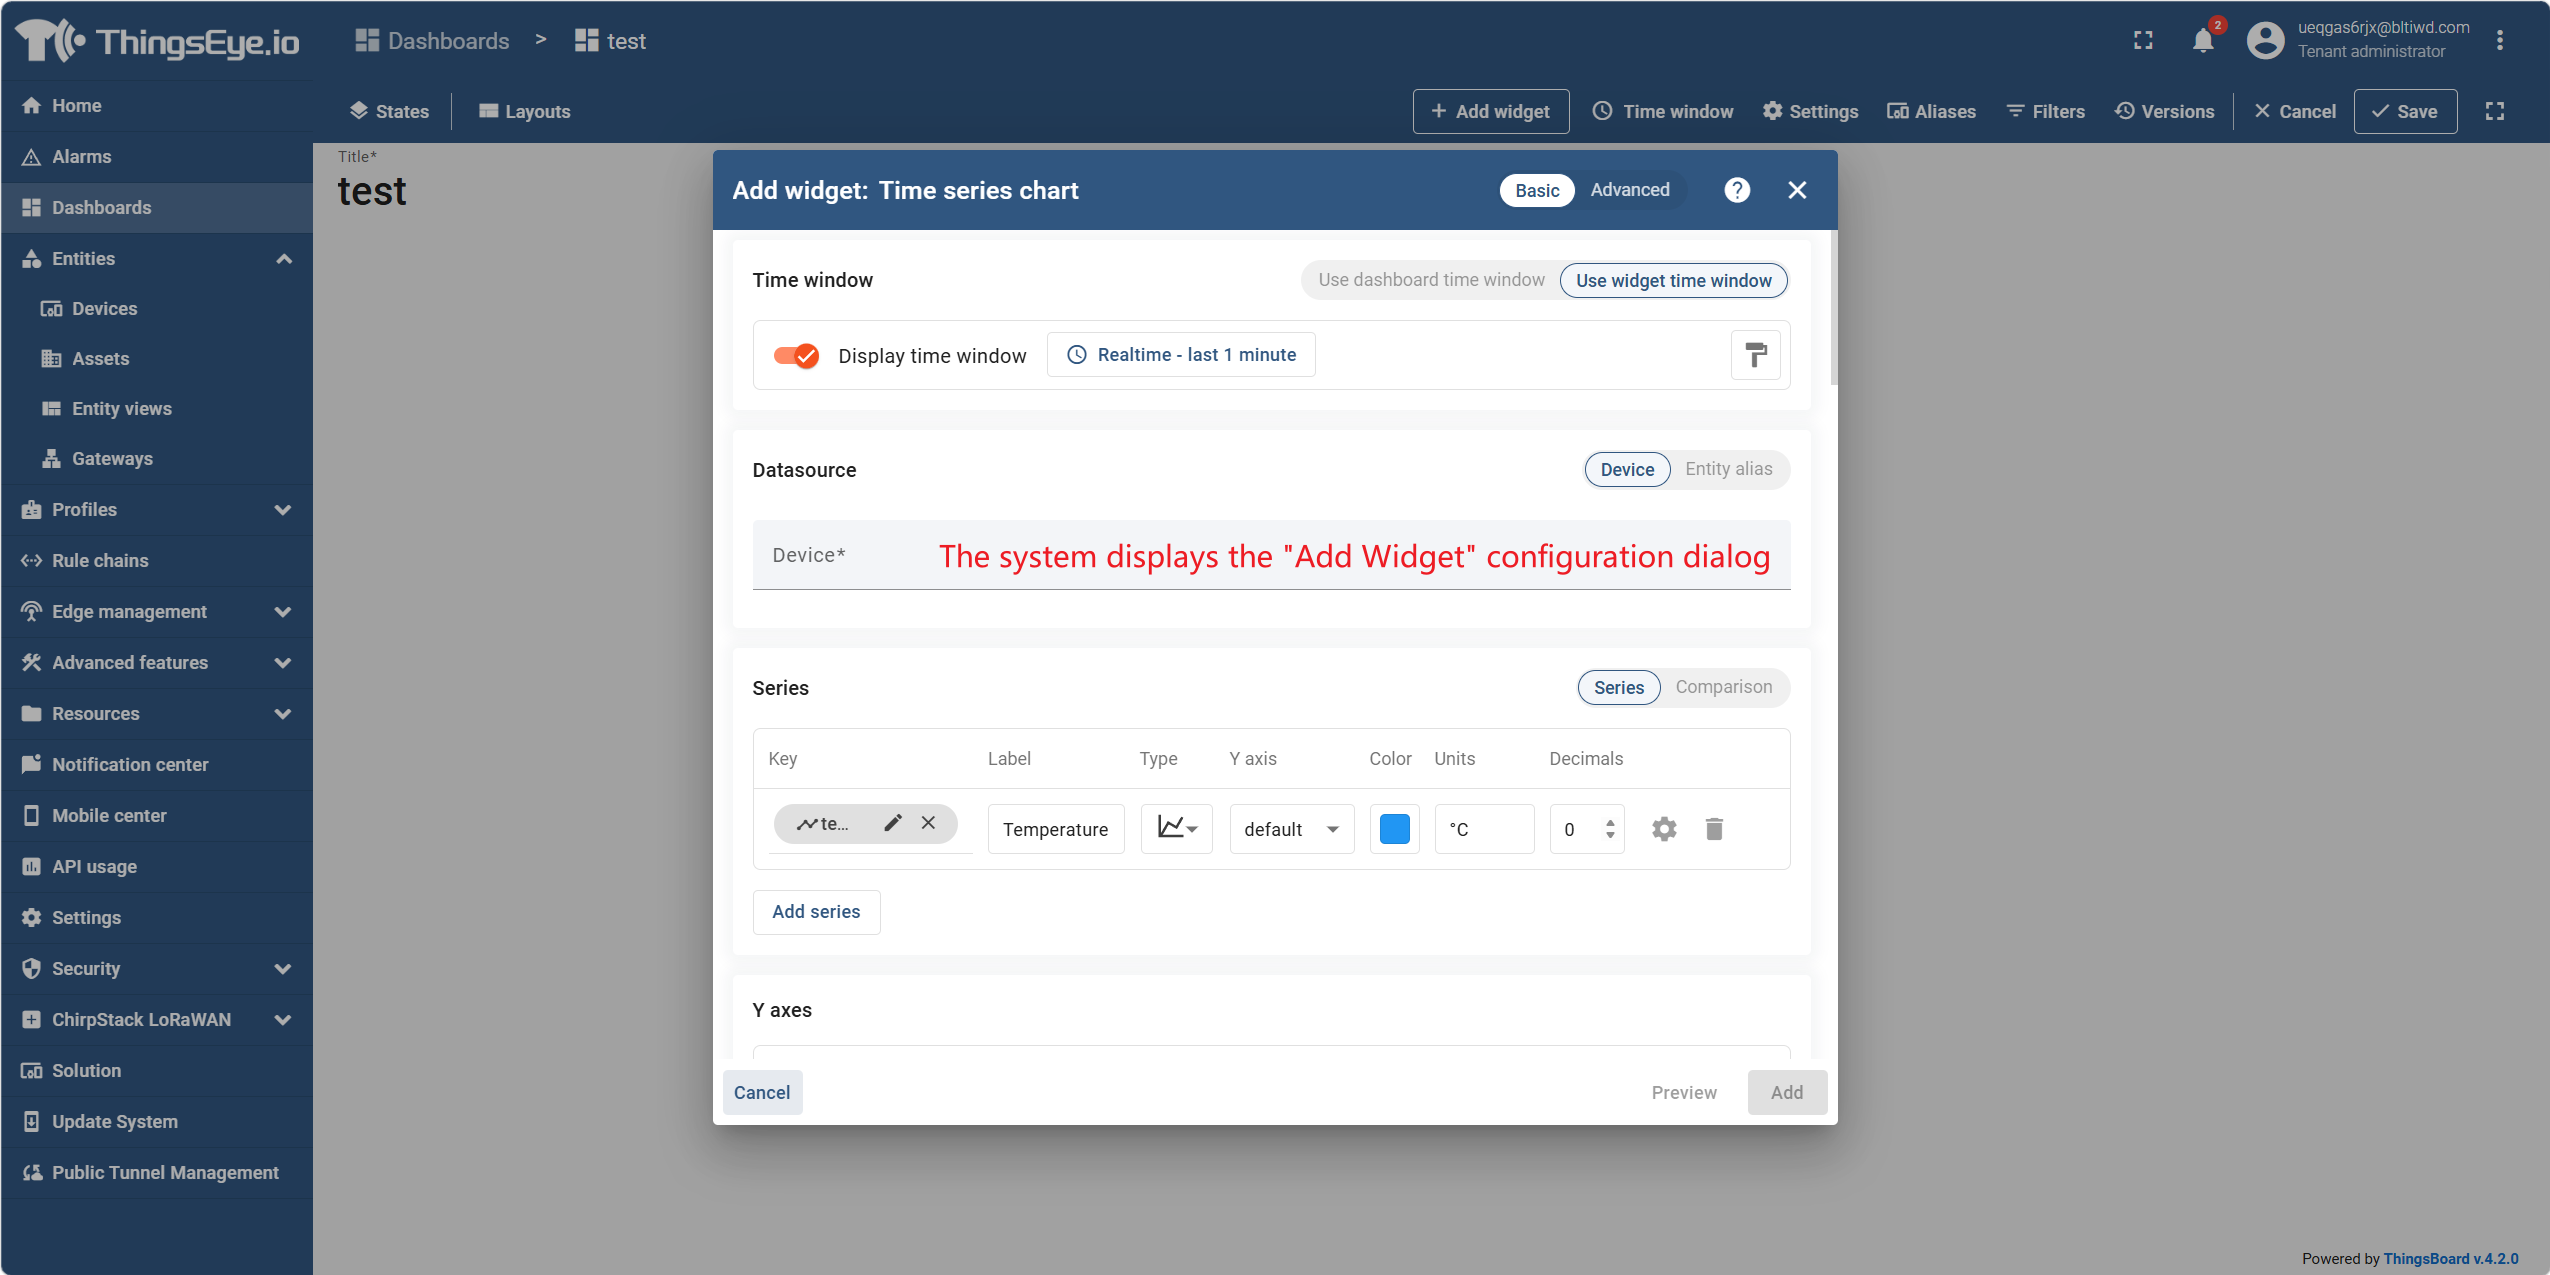
Step 4: Configure data sources
In the "Add Widget" dialog, configure the data source for the widget. The data source determines which entity and which data the widget reads.
Data source types include:
| Type | Description | Use Case |
|---|---|---|
| Device | Reads data from a single specified device | Widget always displays data from a particular device |
| Entity | Resolves one or more entities via an entity alias | Supports context‑aware or multi‑entity display (e.g., list of all devices) |
| Function | Uses a JavaScript function to generate simulated data | Preview widget appearance when no real‑time data is available |
| Entity Count | Returns the total number of entities matching an alias/filter | Displays metrics like "Total Devices" |
| Alarm Count | Returns the total number of alarms matching a filter | Displays metrics like "Active Alarms" |
Configure data keys: A data key specifies the specific telemetry, attribute, or entity field that the widget reads. Click the "Data Key" row and select an existing key from the dropdown menu; if the key does not yet exist, you can manually enter a name and select a type (Attribute / Time series / Entity field), and it will display after data is reported.
Different widget types support different data key sources: time‑series widgets support time‑series keys; latest‑value widgets support time‑series, attribute, and entity fields; alarm widgets support all types as well as alarm fields; static and control widgets do not require data keys.
Step 5: Adjust appearance and advanced settings
In the "Appearance" tab of the dialog, you can adjust display parameters such as title, unit, decimal places, and colour. Click the toggle switch in the upper‑right corner to switch to "Advanced Mode", which supports fine‑grained controls such as multiple data sources, filters, widget card parameters, actions, and layout.
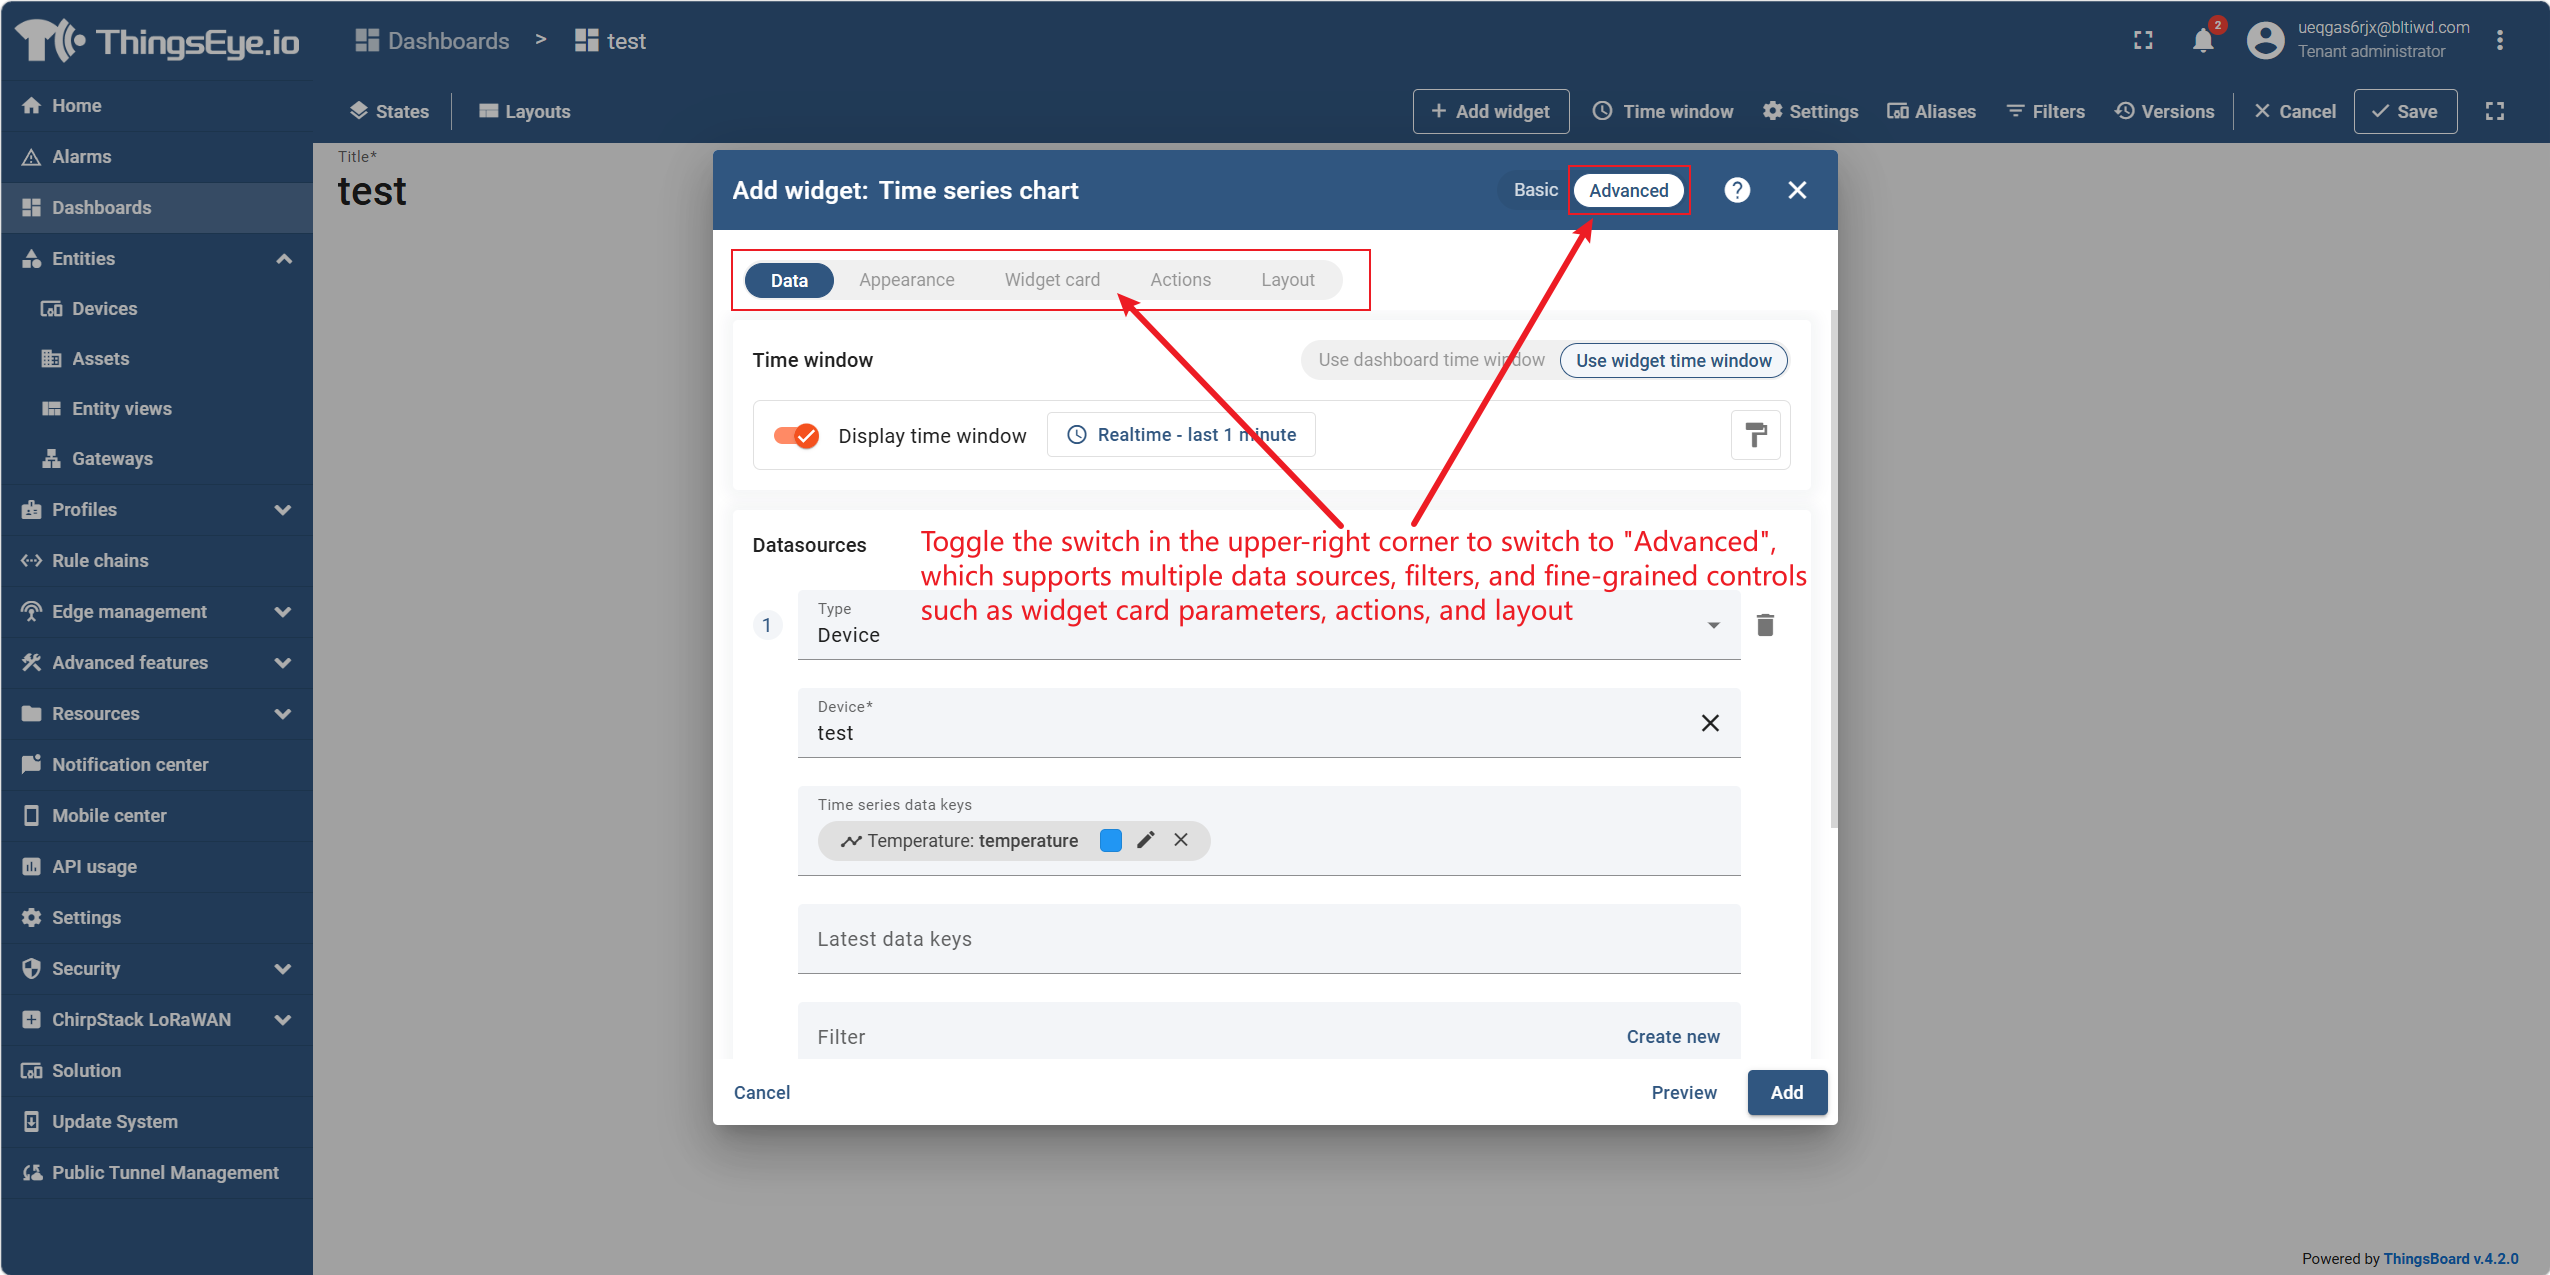
Step 6: Complete the addition and save
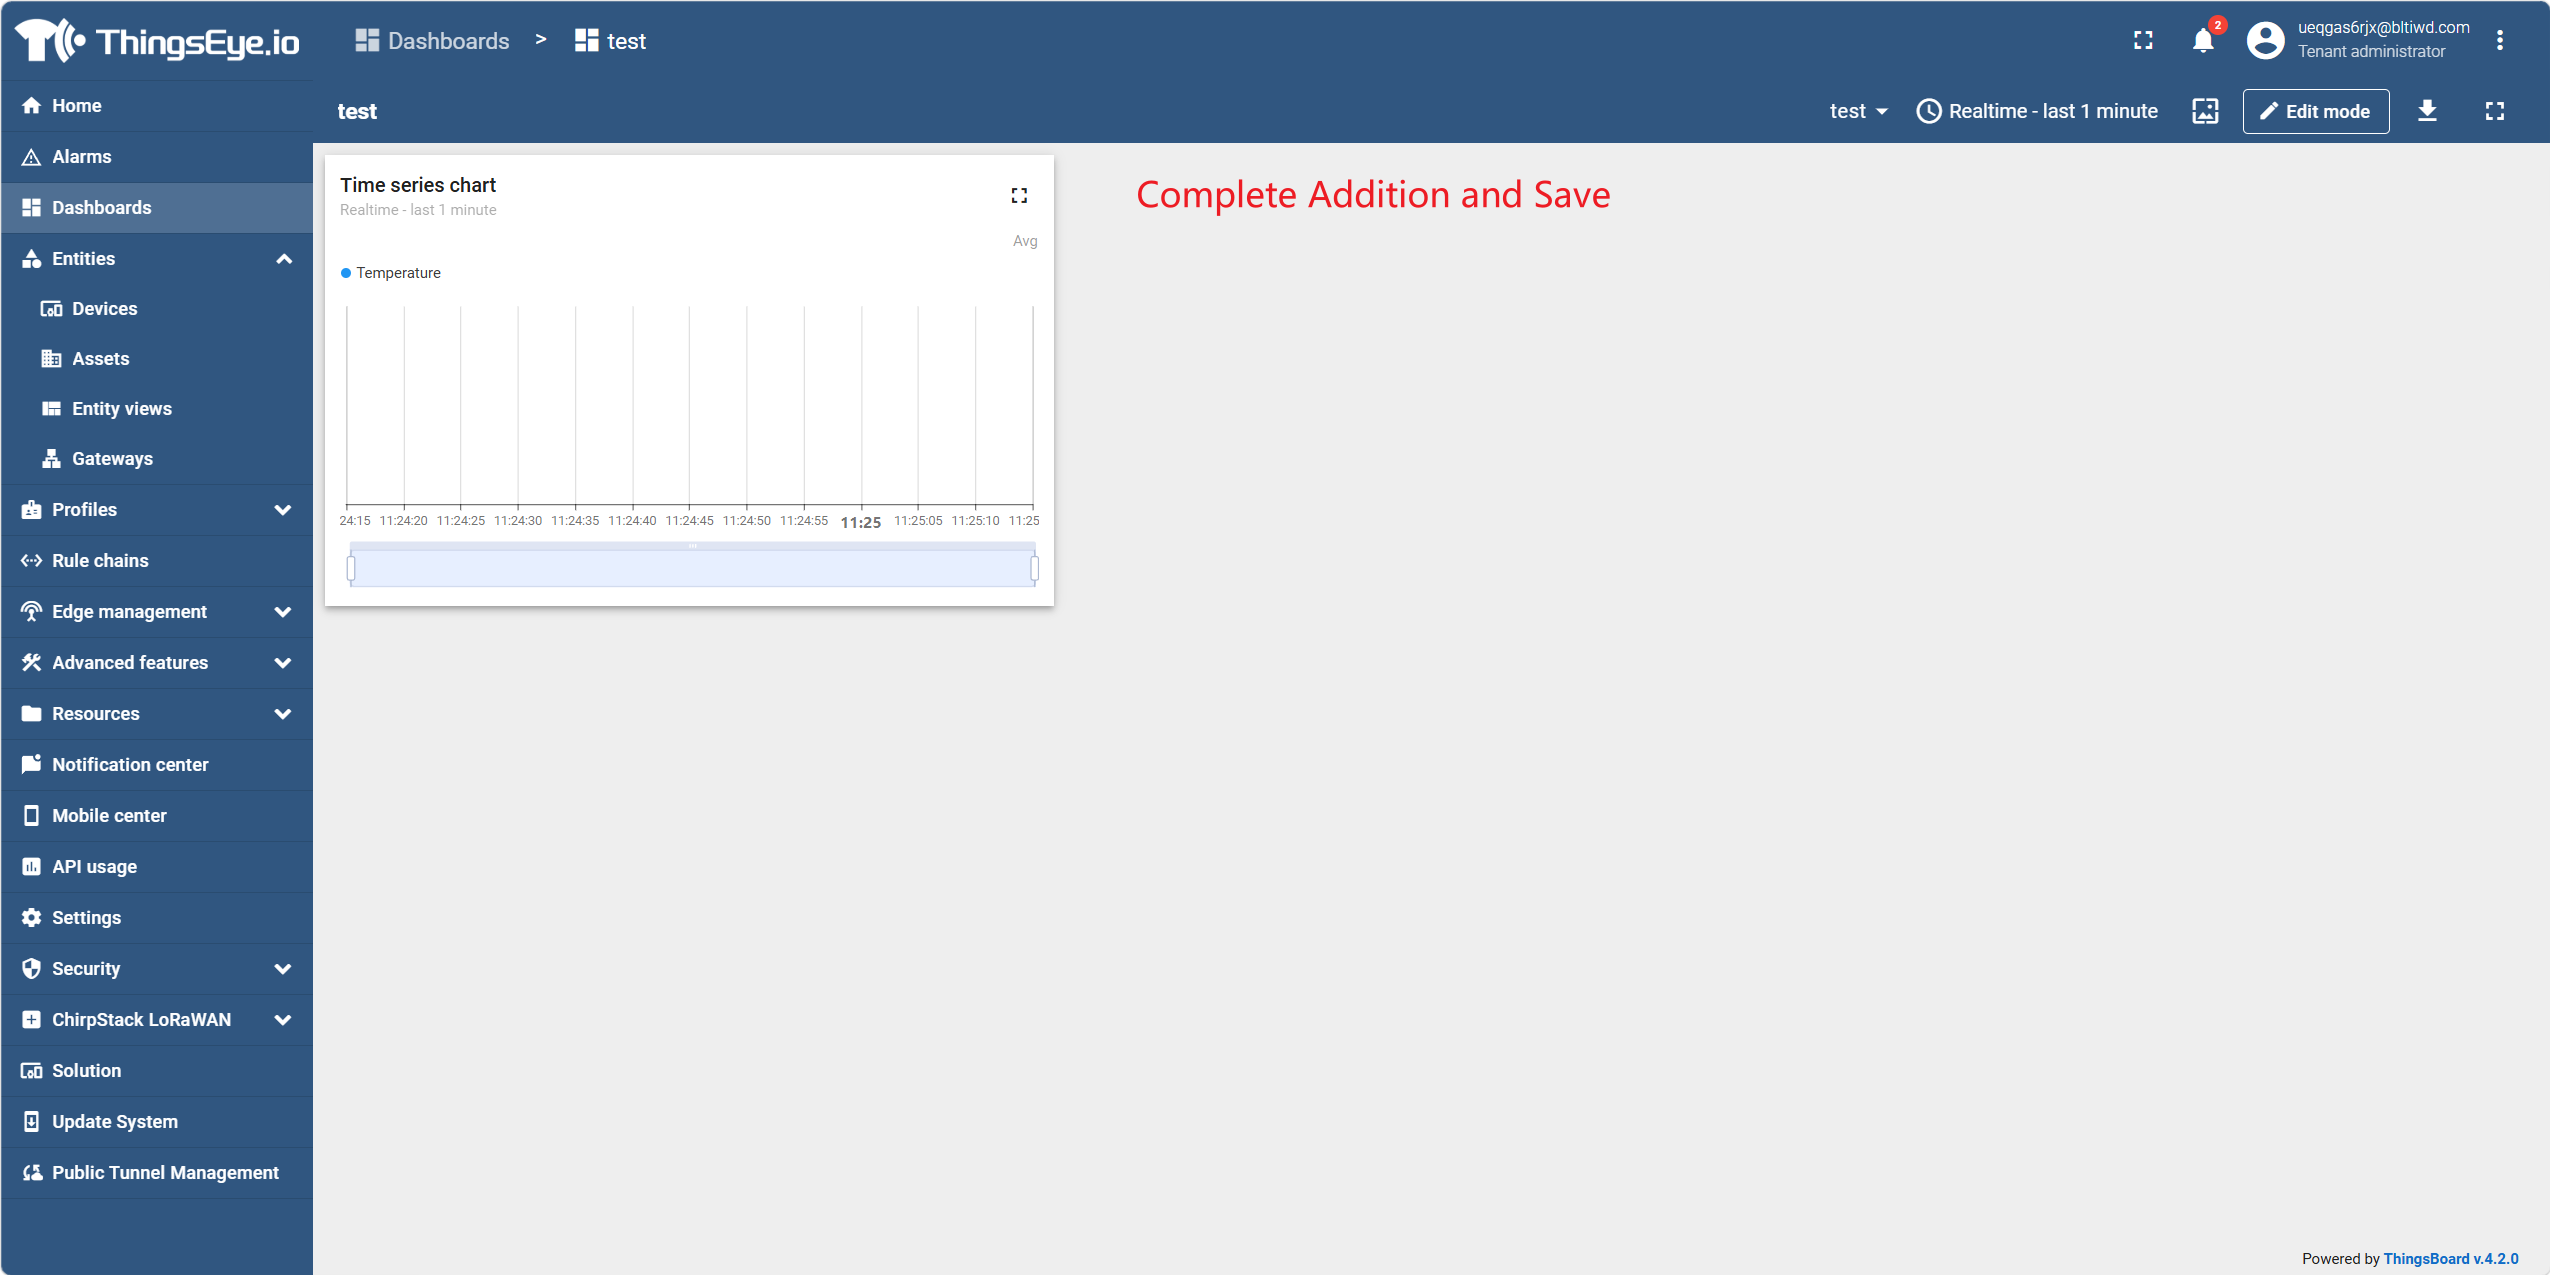
Click the "Add" button at the bottom of the dialog; the widget is added to the dashboard canvas.
On the canvas, you can drag the widget to reposition it, and drag its edges to resize it.
Click the "Save" button at the top of the interface to save all changes to the dashboard.
If the widget's configured data source has not yet reported data, the widget area may show a "No data" state. After the device reports data, the widget will update automatically.
3. Configure Dashboard Data Sources
Procedure
Step 1: Understand widget data source types
When adding or editing a widget, you need to configure the data source in the "Add Widget" dialog. The data source determines which entity and which data the widget reads. Different data source types are suitable for different scenarios.
| Data Source Type | Description | Use Case |
|---|---|---|
| Device | Reads data from a single specified device | Widgets that always display data from a specific device (e.g., device details page) |
| Entity Alias | Resolves one or more entities via an alias, supporting static and dynamic modes | Context‑aware or multi‑entity display (recommended approach) |
| Function | Uses a JavaScript function to generate simulated data (e.g., Sin, Cos, Random) | Preview widget appearance or test layout without real‑time data |
| Entity Count | Returns the total number of entities matching an alias or filter | Displays metrics like "Total Devices" or "Active Gateways" |
| Alarm Count | Returns the total number of alarms matching a filter | Displays metrics like "Active Critical Alarms" |
Detailed data source type descriptions:
| Type | Description |
|---|---|
| Device | Reads data from a single explicitly selected device. Used for widgets that always display data from the same device, independent of dashboard context. |
| Entity Alias | Reads data from one or more entities resolved by an entity alias. An alias can point to a single entity (e.g., a device in the current dashboard context) or a dynamic list (e.g., all devices of a given type). Used for context‑aware and multi‑entity widgets. |
| Function | Uses a JavaScript function to generate synthetic values (e.g., random numbers, sine waves). Used for configuring and previewing widget appearance during development without real device data. |
| Entity Count | Returns the number of entities matching an alias and optional filters as a single numeric value. Used for value‑card widgets displaying metrics like "Total Devices" or "Active Gateways". |
| Alarm Count | Returns the number of alarms matching the selected entity scope and alarm filters (severity, status, type, assignee) as a single numeric value. Used for value‑card widgets displaying metrics like "Active Critical Alarms". |
Step 2: Understand entity aliases
An entity alias is a core concept for dashboard widget data sources. An alias is a reference to one or more entities that serves as a data source for dashboard widgets. Aliases can be static (fixed, pre‑selected entities) or dynamic (resolved at runtime based on entity type, relationships, or dashboard state).
Advantages of aliases:
- Decouple widget configuration from specific entities: Changing the data source only requires modifying the alias definition, not each widget individually.
- Support dynamic resolution: Entities can be automatically resolved based on dashboard state and current user context.
- Support multiple entities: One alias can match multiple entities, suitable for widgets such as tables and charts that need to display data from multiple devices.
Alias types:
| Alias Type | Description | Use Case |
|---|---|---|
| Single Entity | Resolves to a single specific entity selected by type and name | Always display data from a specific device |
| Entity List | Resolves to a list of multiple manually selected entities | Select and display multiple devices from existing entities |
| Entity Name | Resolves to all entities of a specified type whose names start with a given text | Filter devices by naming convention (e.g., all devices starting with "Sensor") |
| Entity Type | Resolves to all entities of a specified type, including customer entities | Display all devices or assets under the current tenant |
| Entity from Dashboard State | Resolves to an entity passed via dashboard state parameters | Drill down from a main dashboard to a device details page |
| Asset Type | Resolves to assets of a specified asset profile, filterable by name | Display assets of a certain type (e.g., all assets of type "Production Line") |
| Device Type | Resolves to devices of a specified device profile, filterable by name | Display devices of a certain type (e.g., all devices of type "Thermostat") |
| Relation Query | Resolves to entities connected to a root entity via relations, with configurable depth and direction | Find all devices associated with a given asset |
| Asset Search Query | Resolves to assets of a specified profile connected to a root entity via relations | Find the production‑line asset associated with a device |
| Device Search Query | Resolves to devices of a specified profile connected to a root entity via relations | Find all thermostat devices associated with an asset |
"Resolve to multiple entities" toggle:
In the alias configuration dialog, the "Resolve to multiple entities" toggle controls whether an alias can return multiple entities. Multi‑entity alias types (such as Entity List, Entity Type) are enabled by default; single‑entity types are disabled by default. Widgets that display a single value (such as value cards) use single‑entity aliases; table and chart widgets typically use multi‑entity aliases.
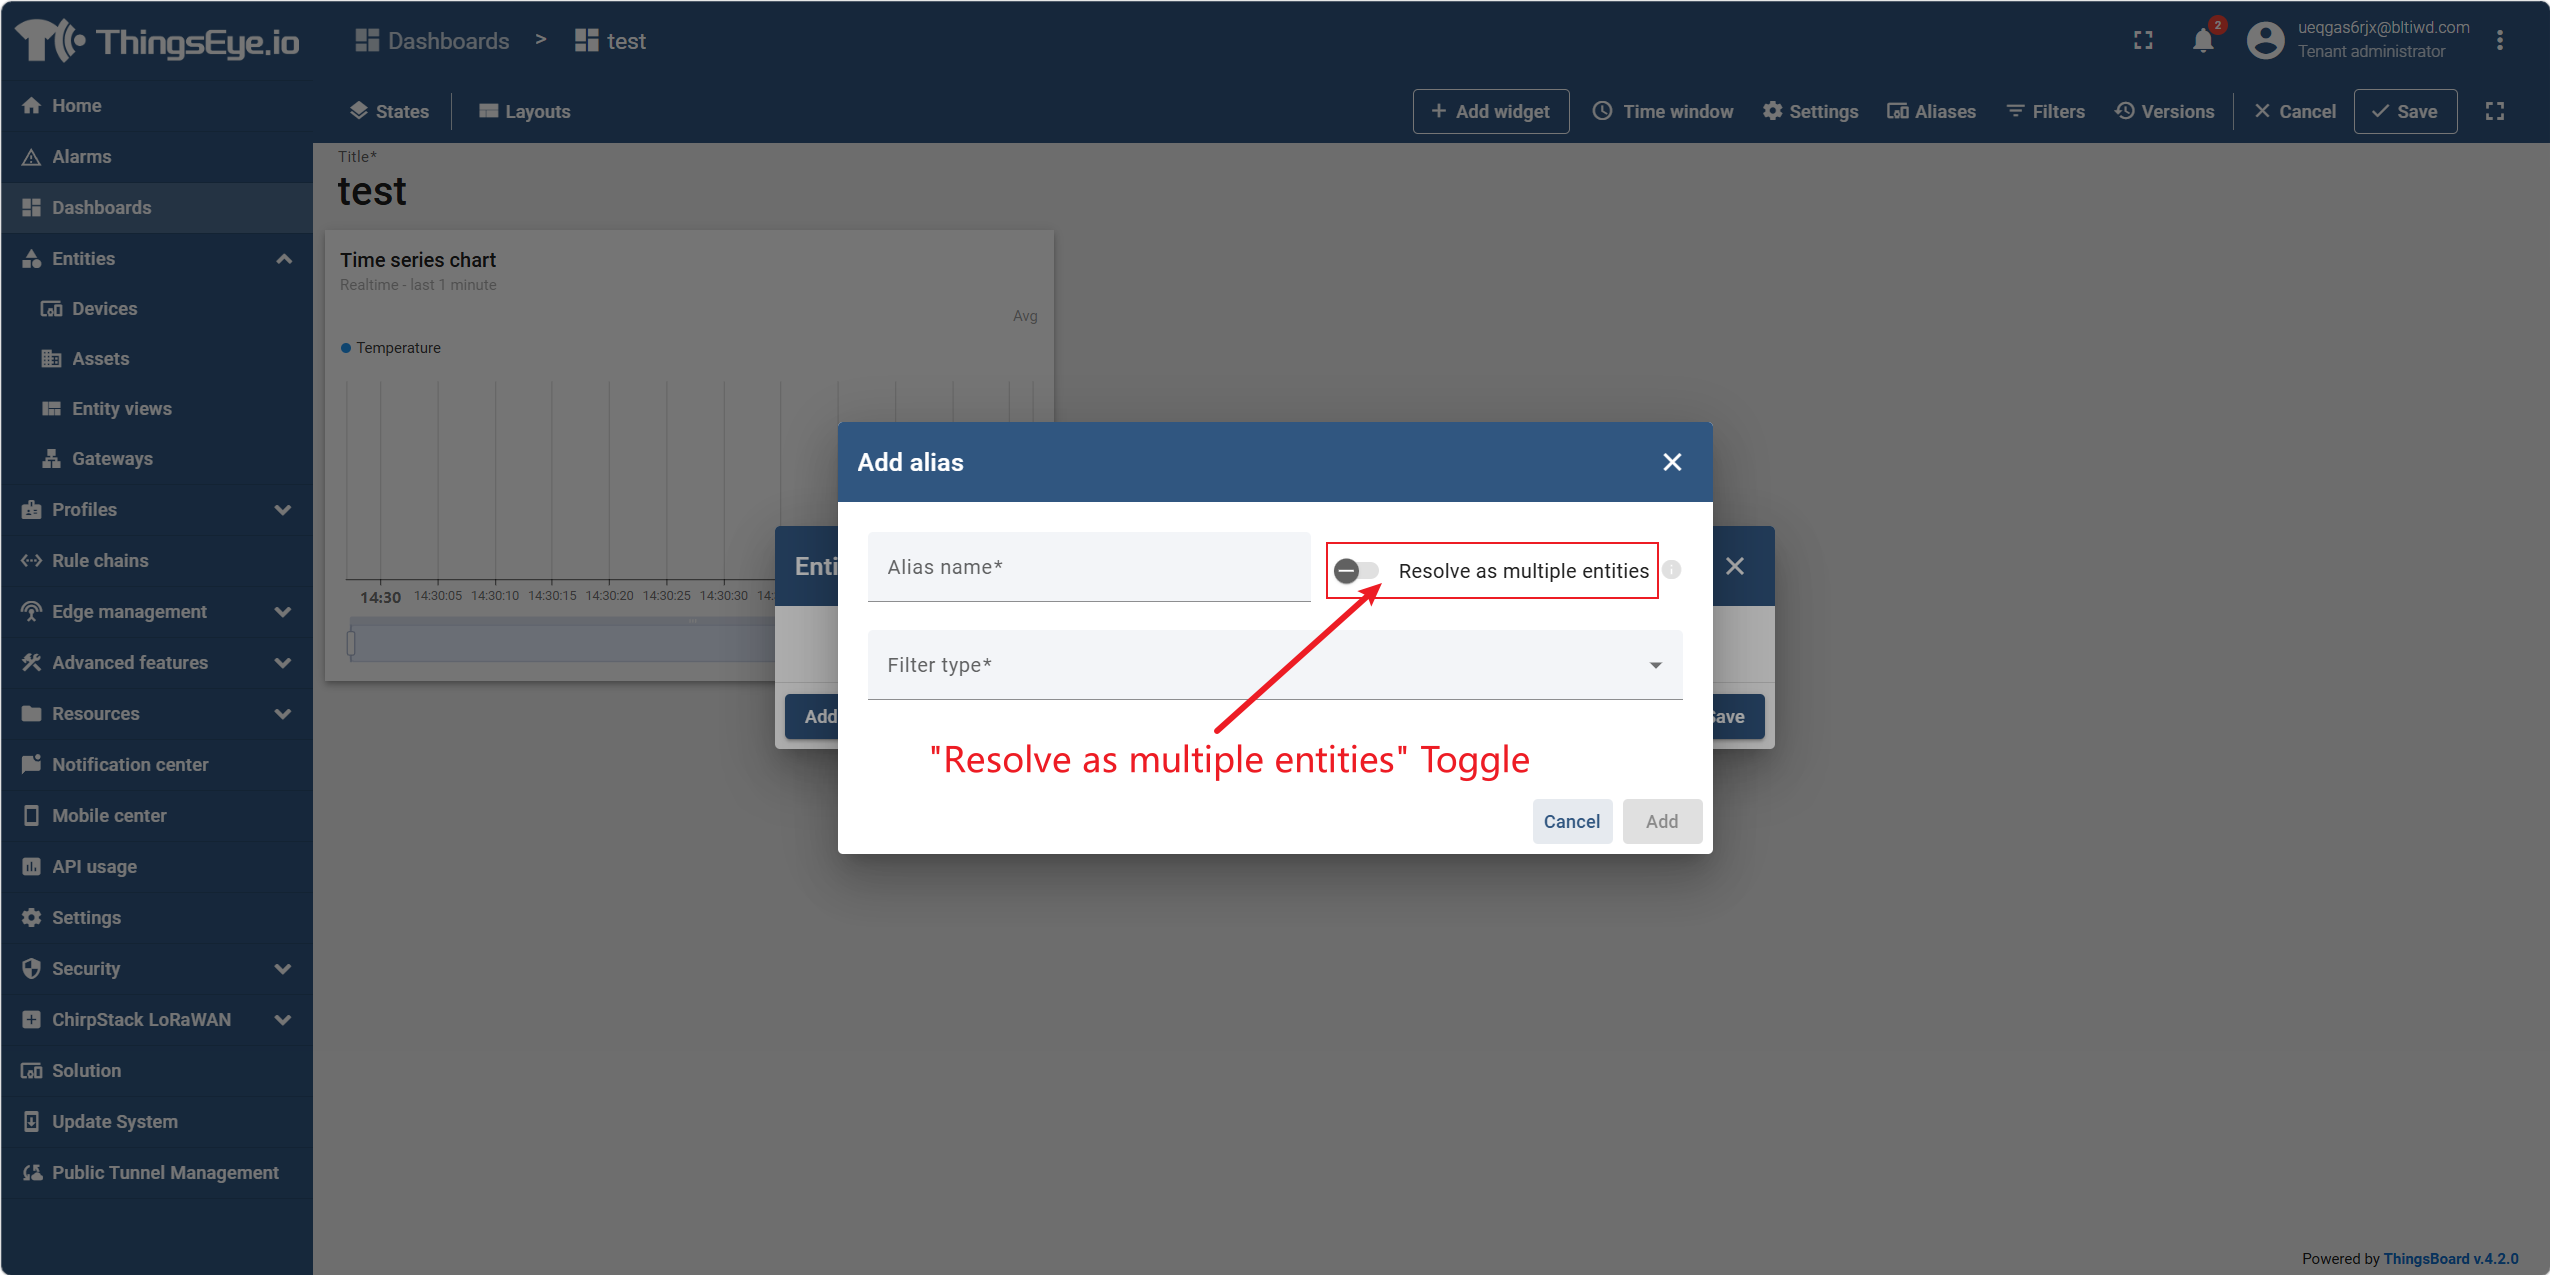
Step 3: Create an entity alias
Entity aliases can be created from the dashboard toolbar or directly while configuring a widget.
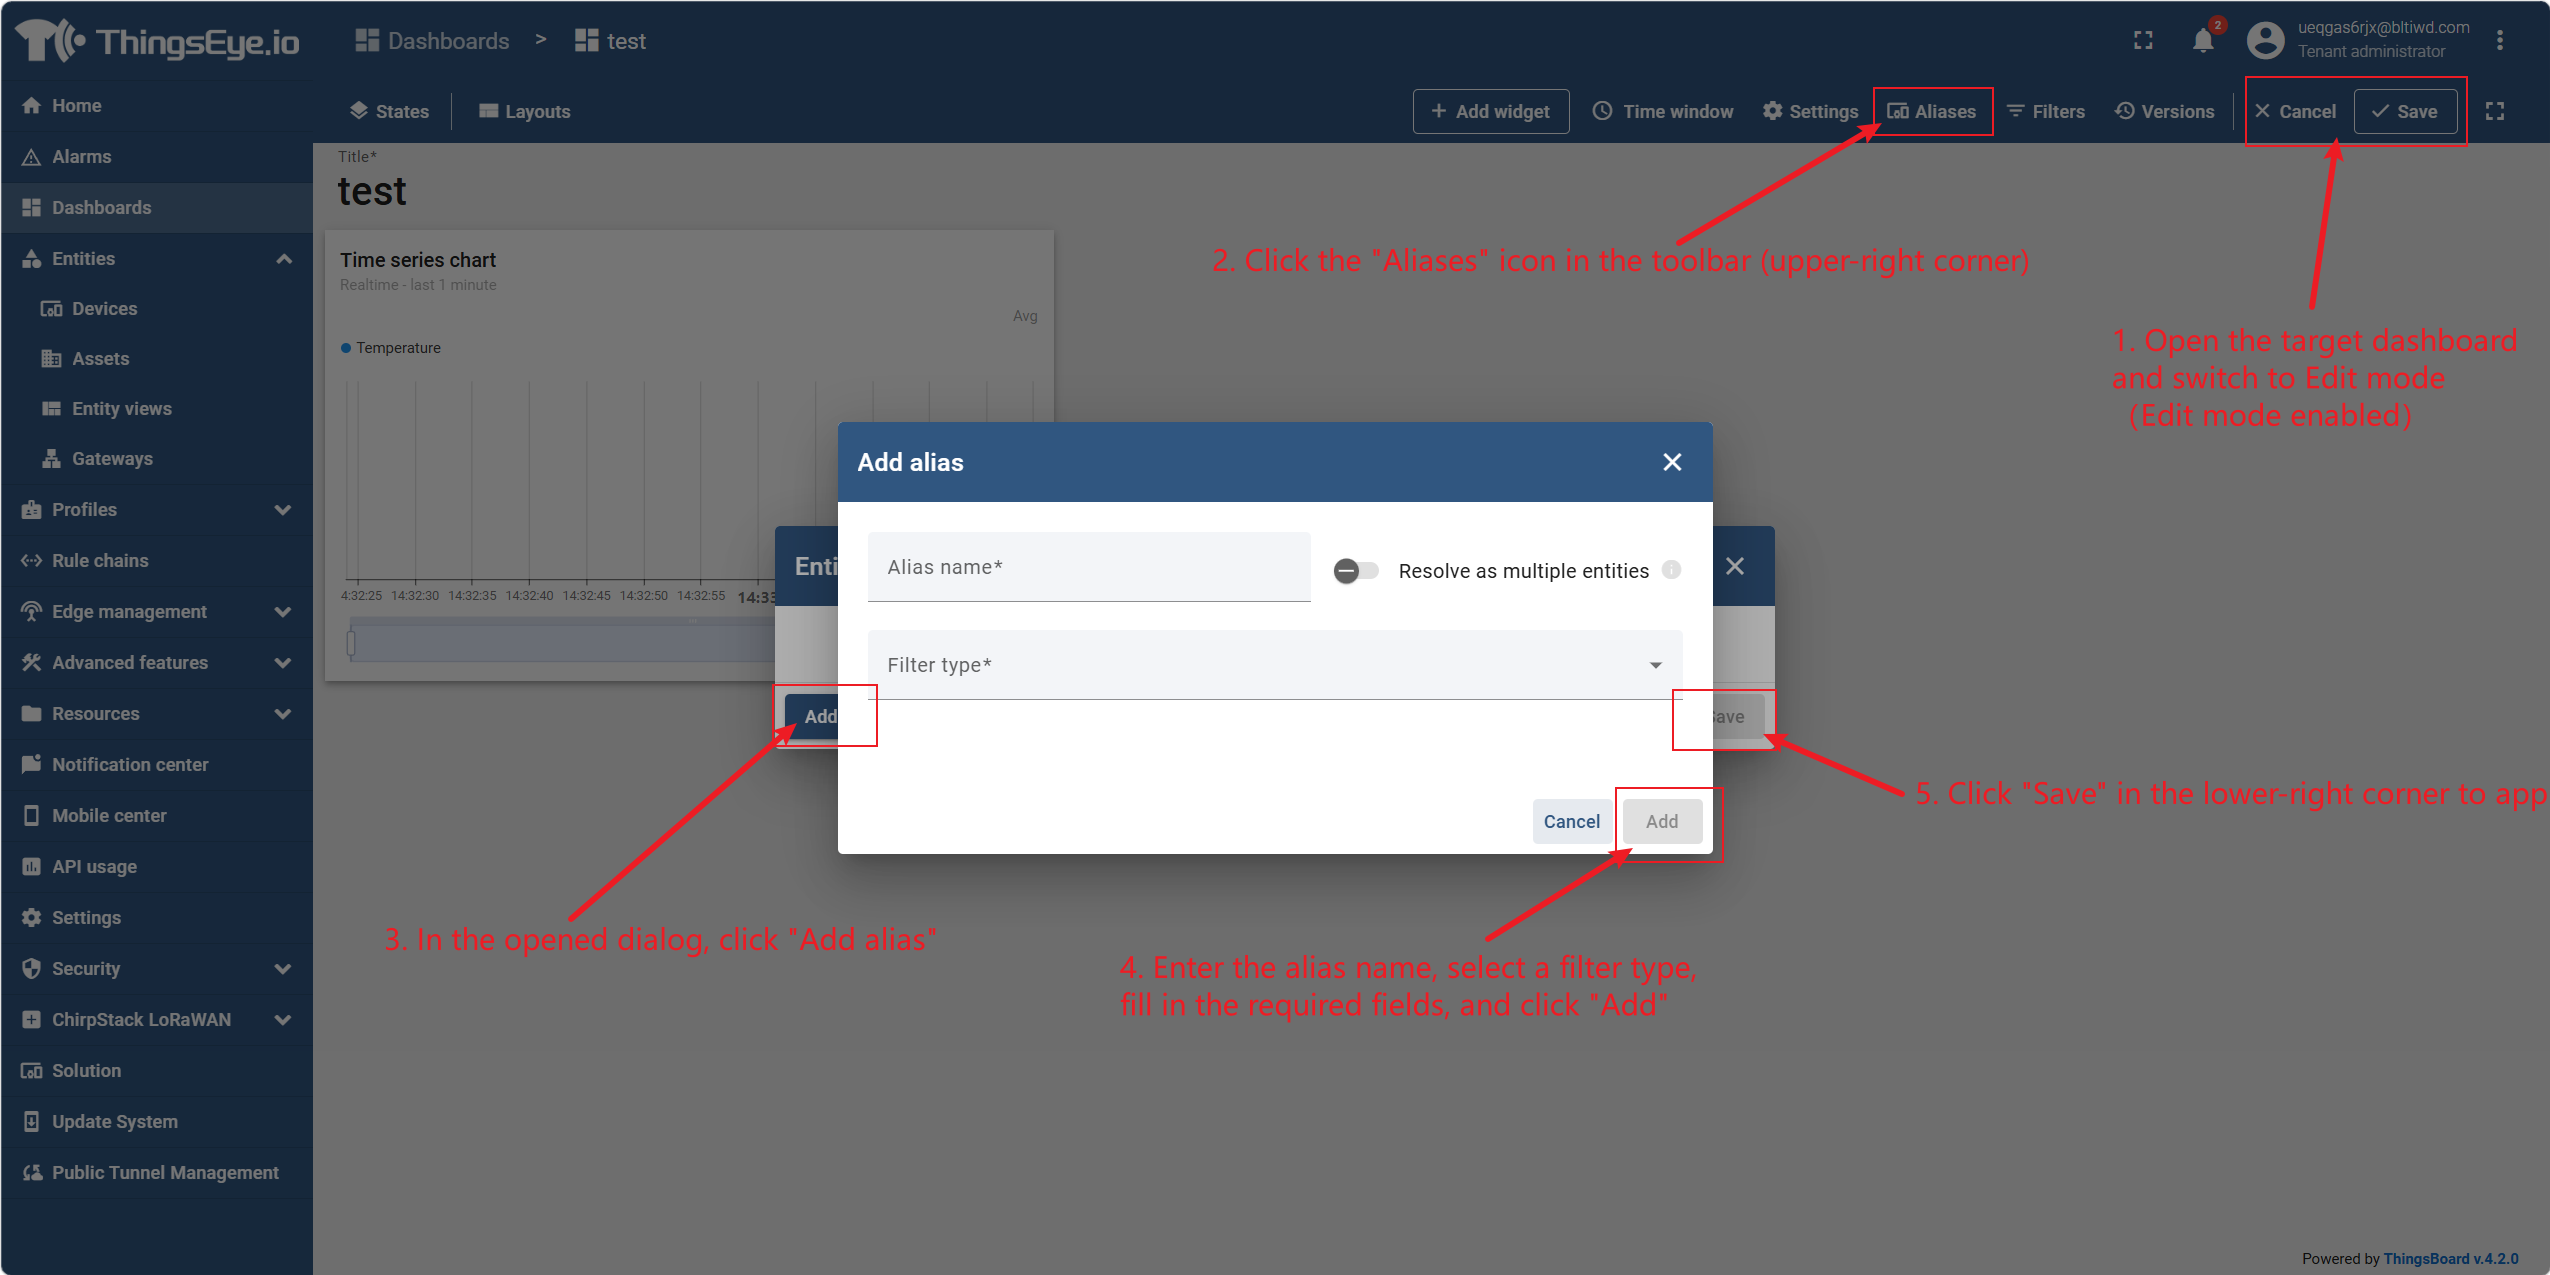
Method 1: Create from the dashboard toolbar
- Open the target dashboard and switch to edit mode.
- Click the "Aliases" icon in the toolbar (upper‑right corner).
- In the dialog that opens, click "Add Alias".
- Enter the alias name, select the filter type, fill in the required fields, and click "Add".
- Click "Save" in the lower‑right corner to apply.
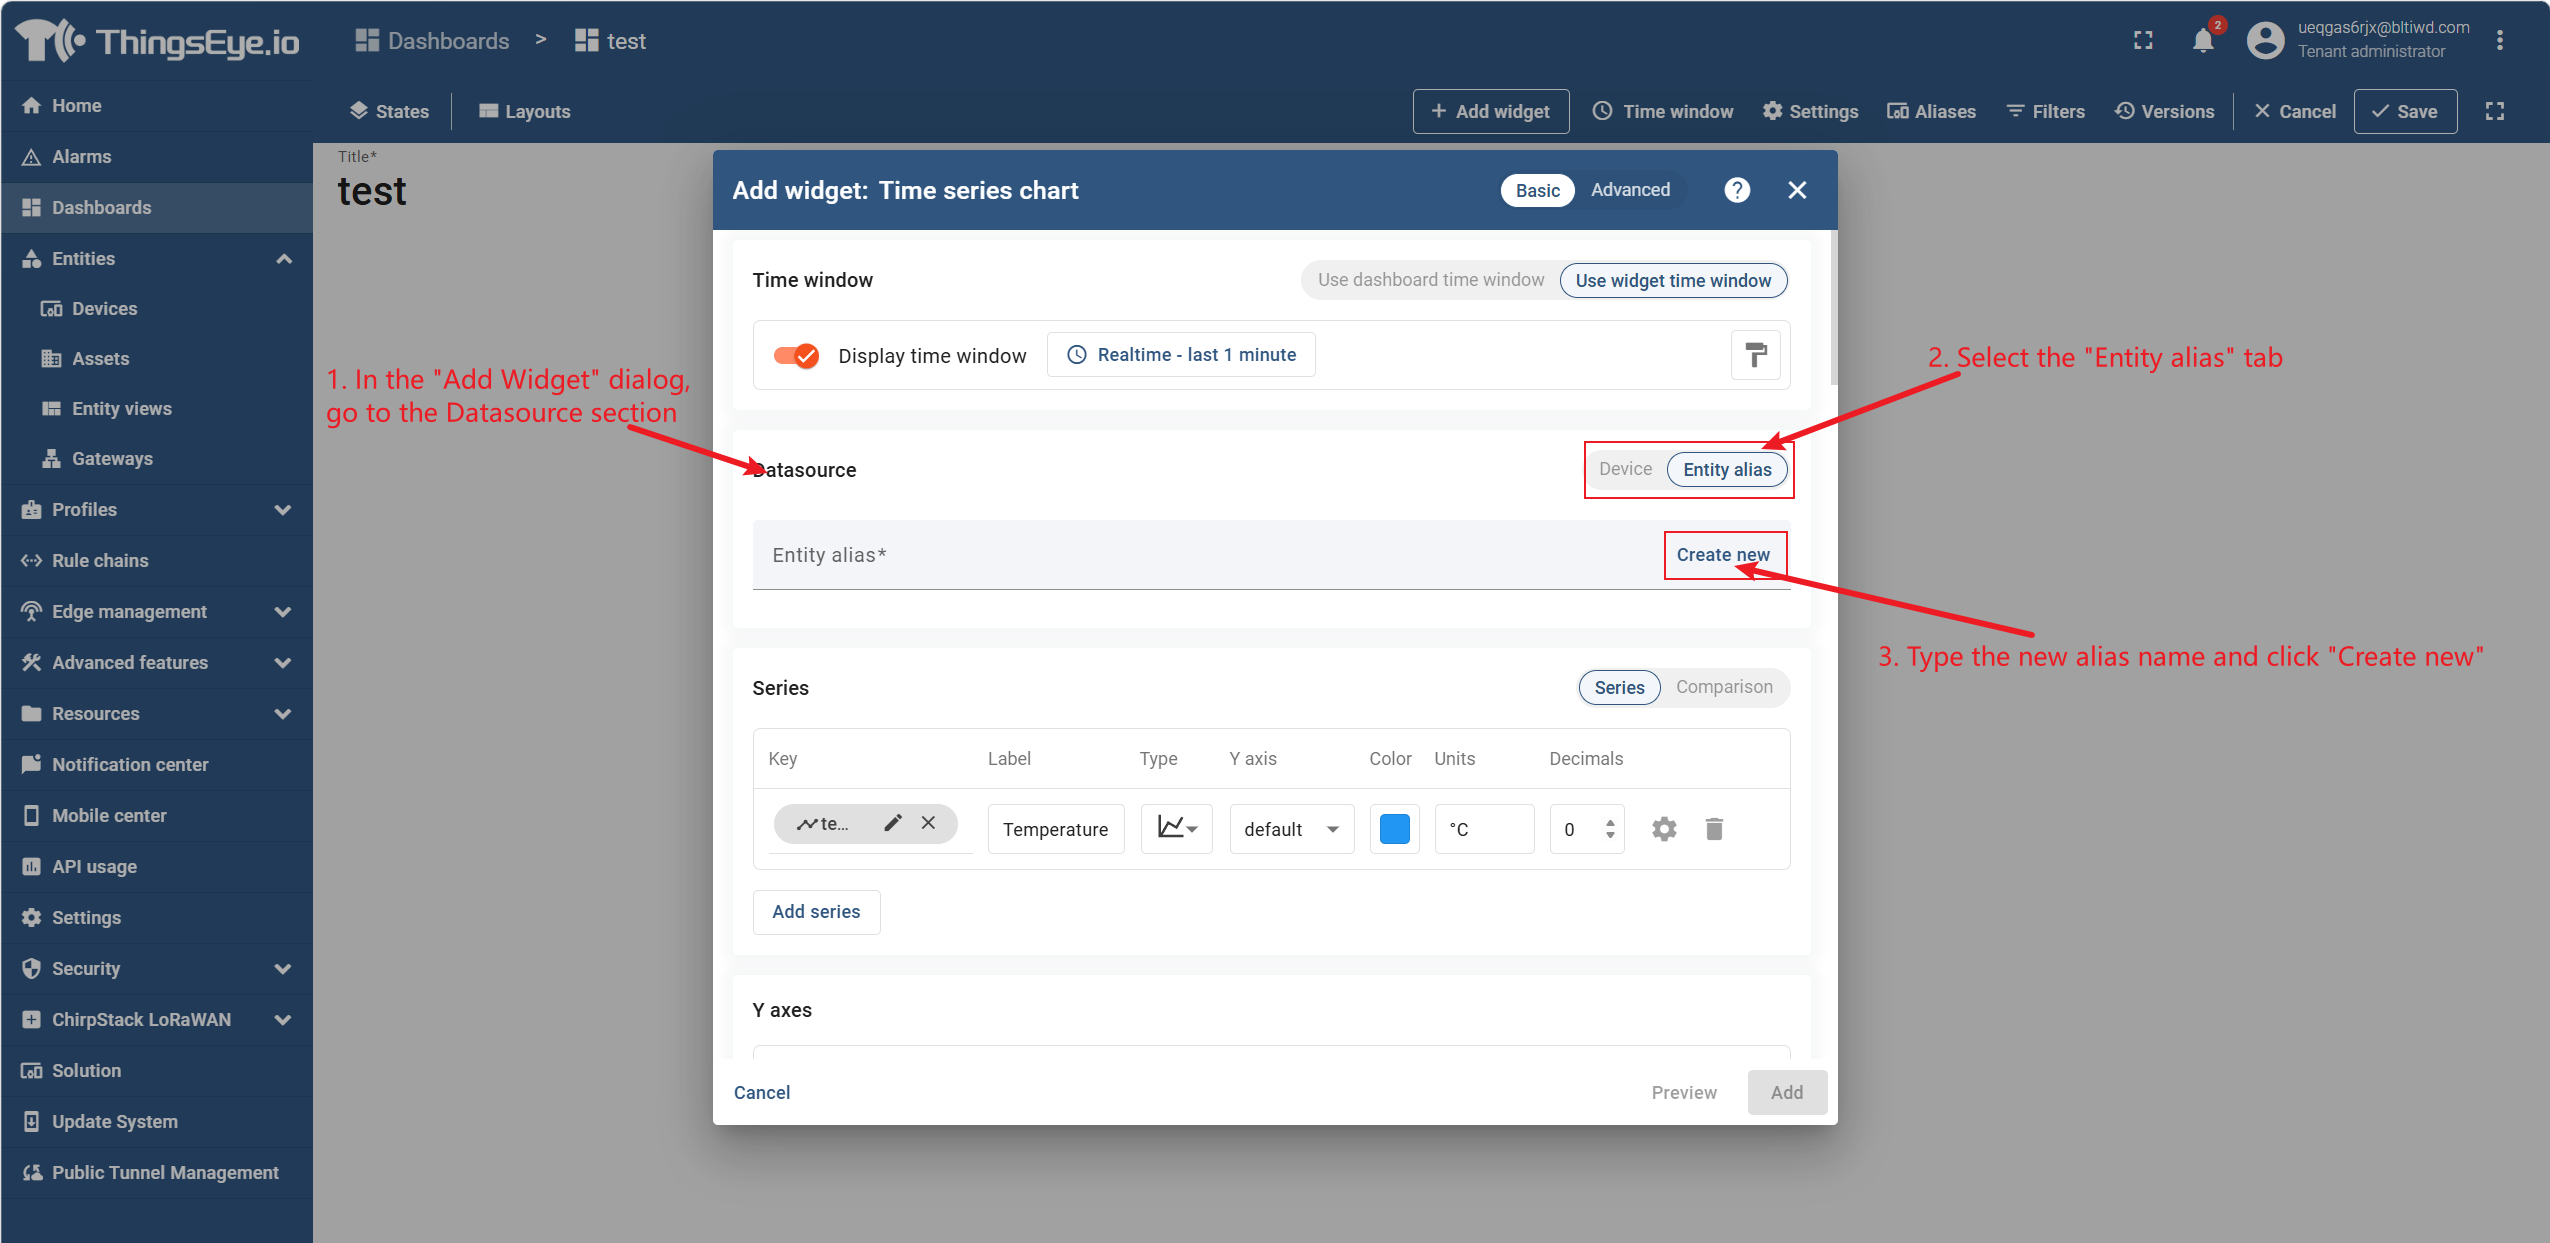
Method 2: Create while configuring a widget
- In the "Add Widget" dialog, go to the data source section.
- Select the "Entity Alias" tab.
- Enter a new alias name and click "Create New Alias".
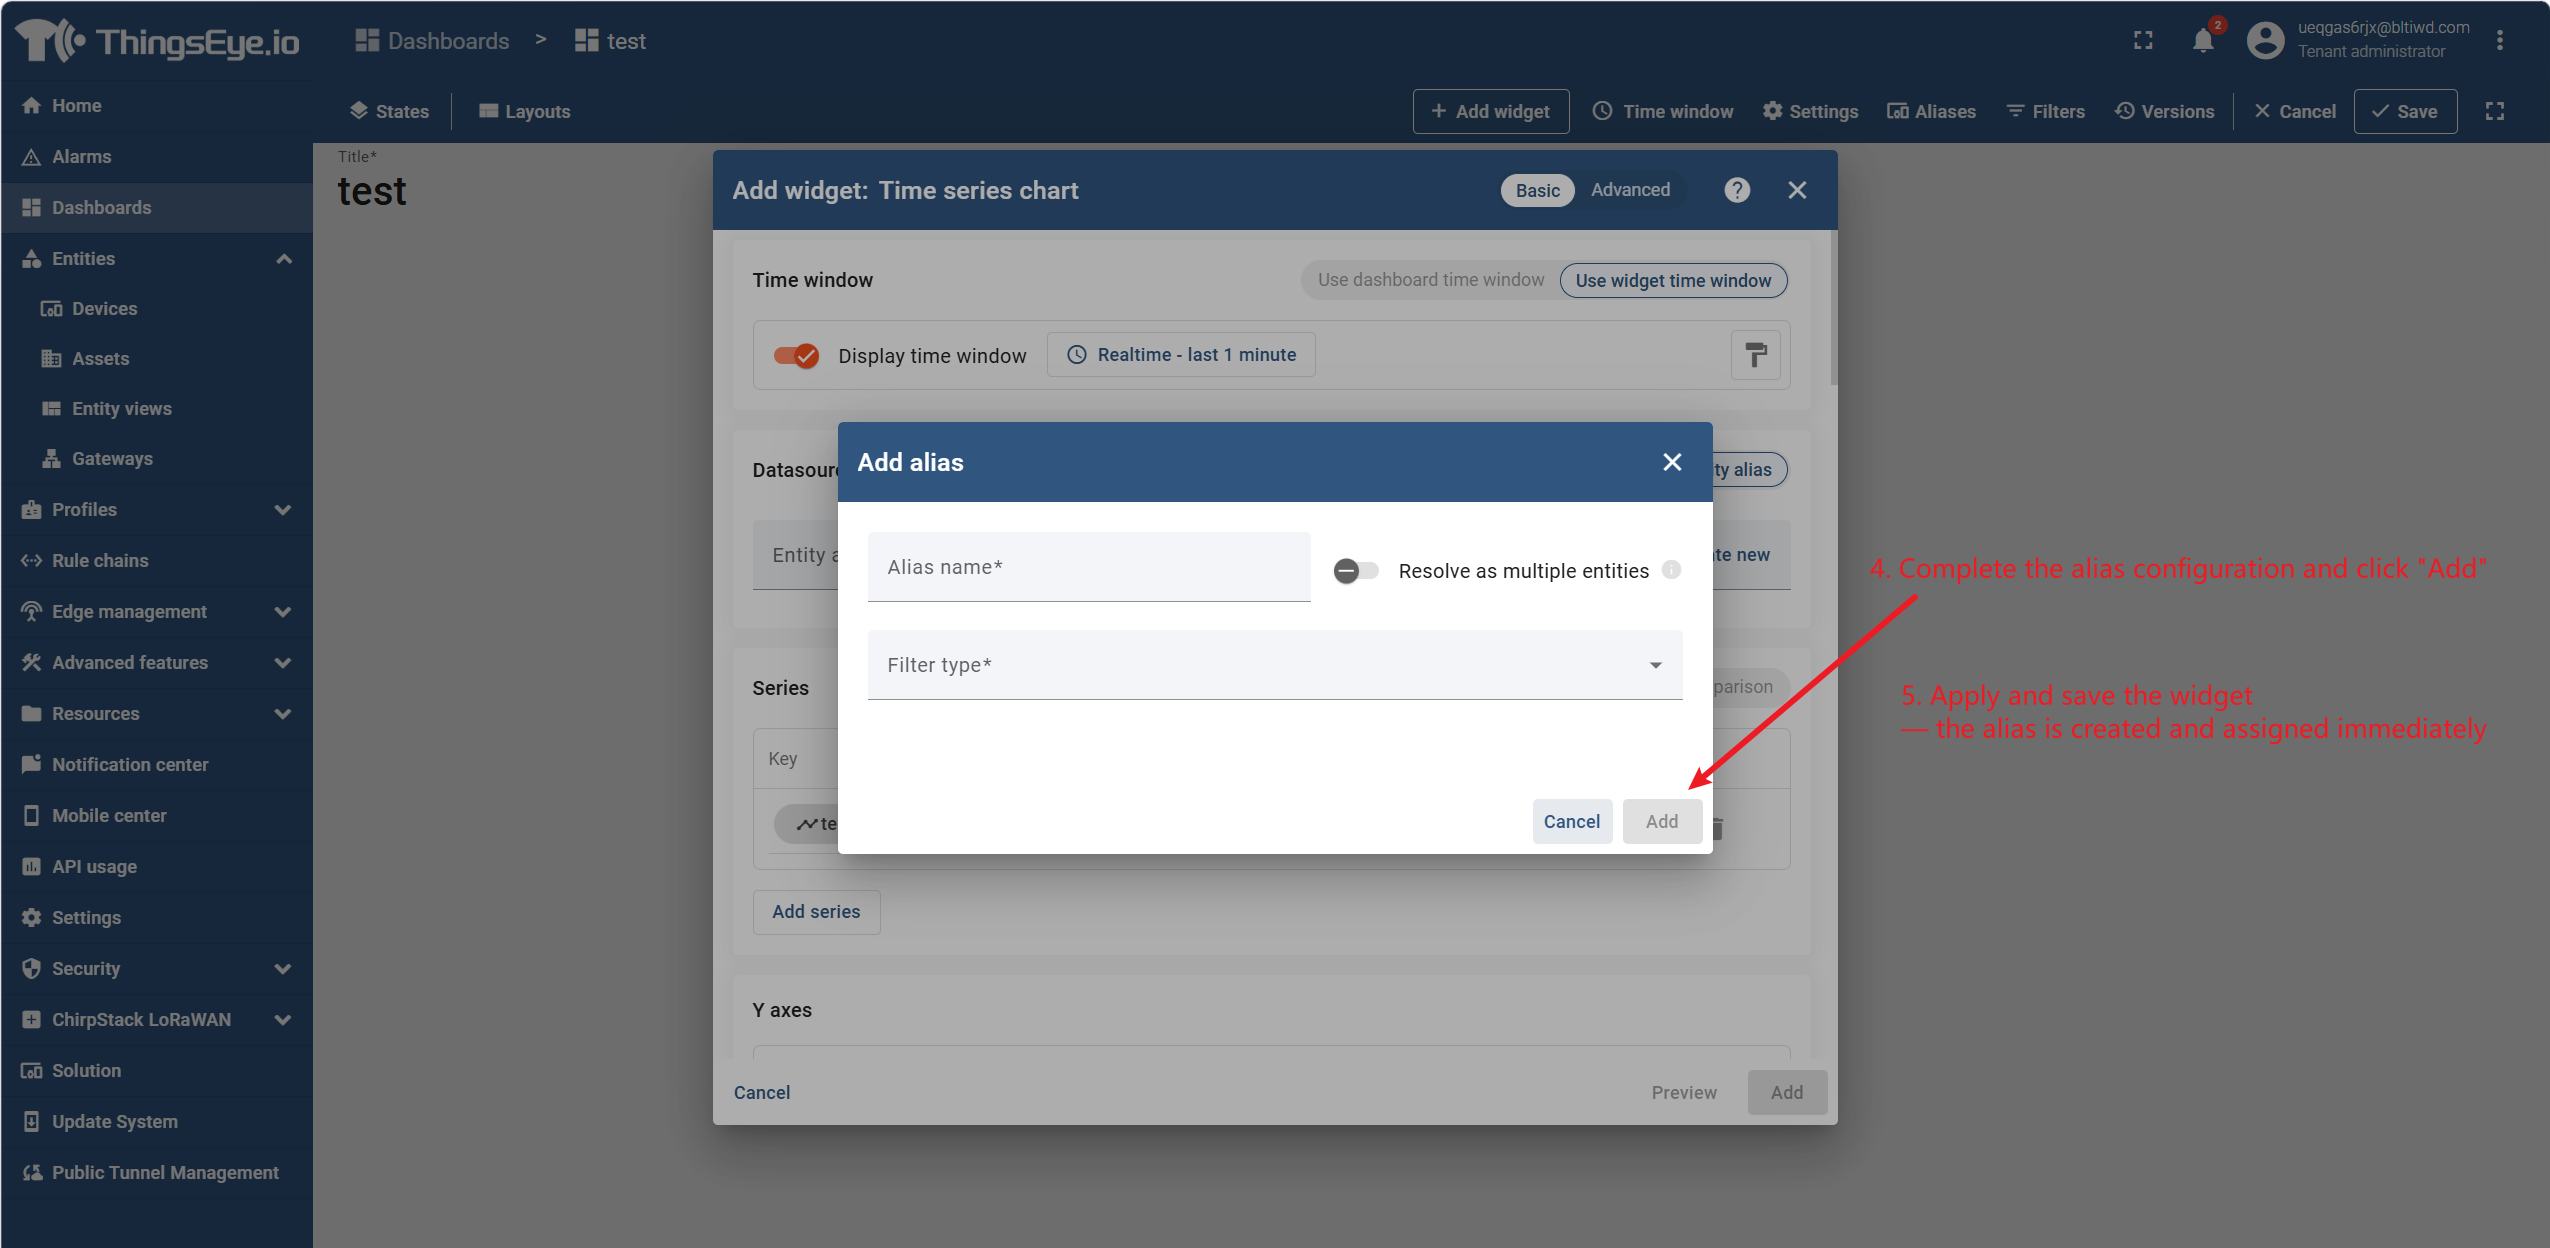
- After completing the alias configuration, click "Add".
- Apply and save the widget — the alias is created and assigned immediately.
Step 4: Edit and delete entity aliases
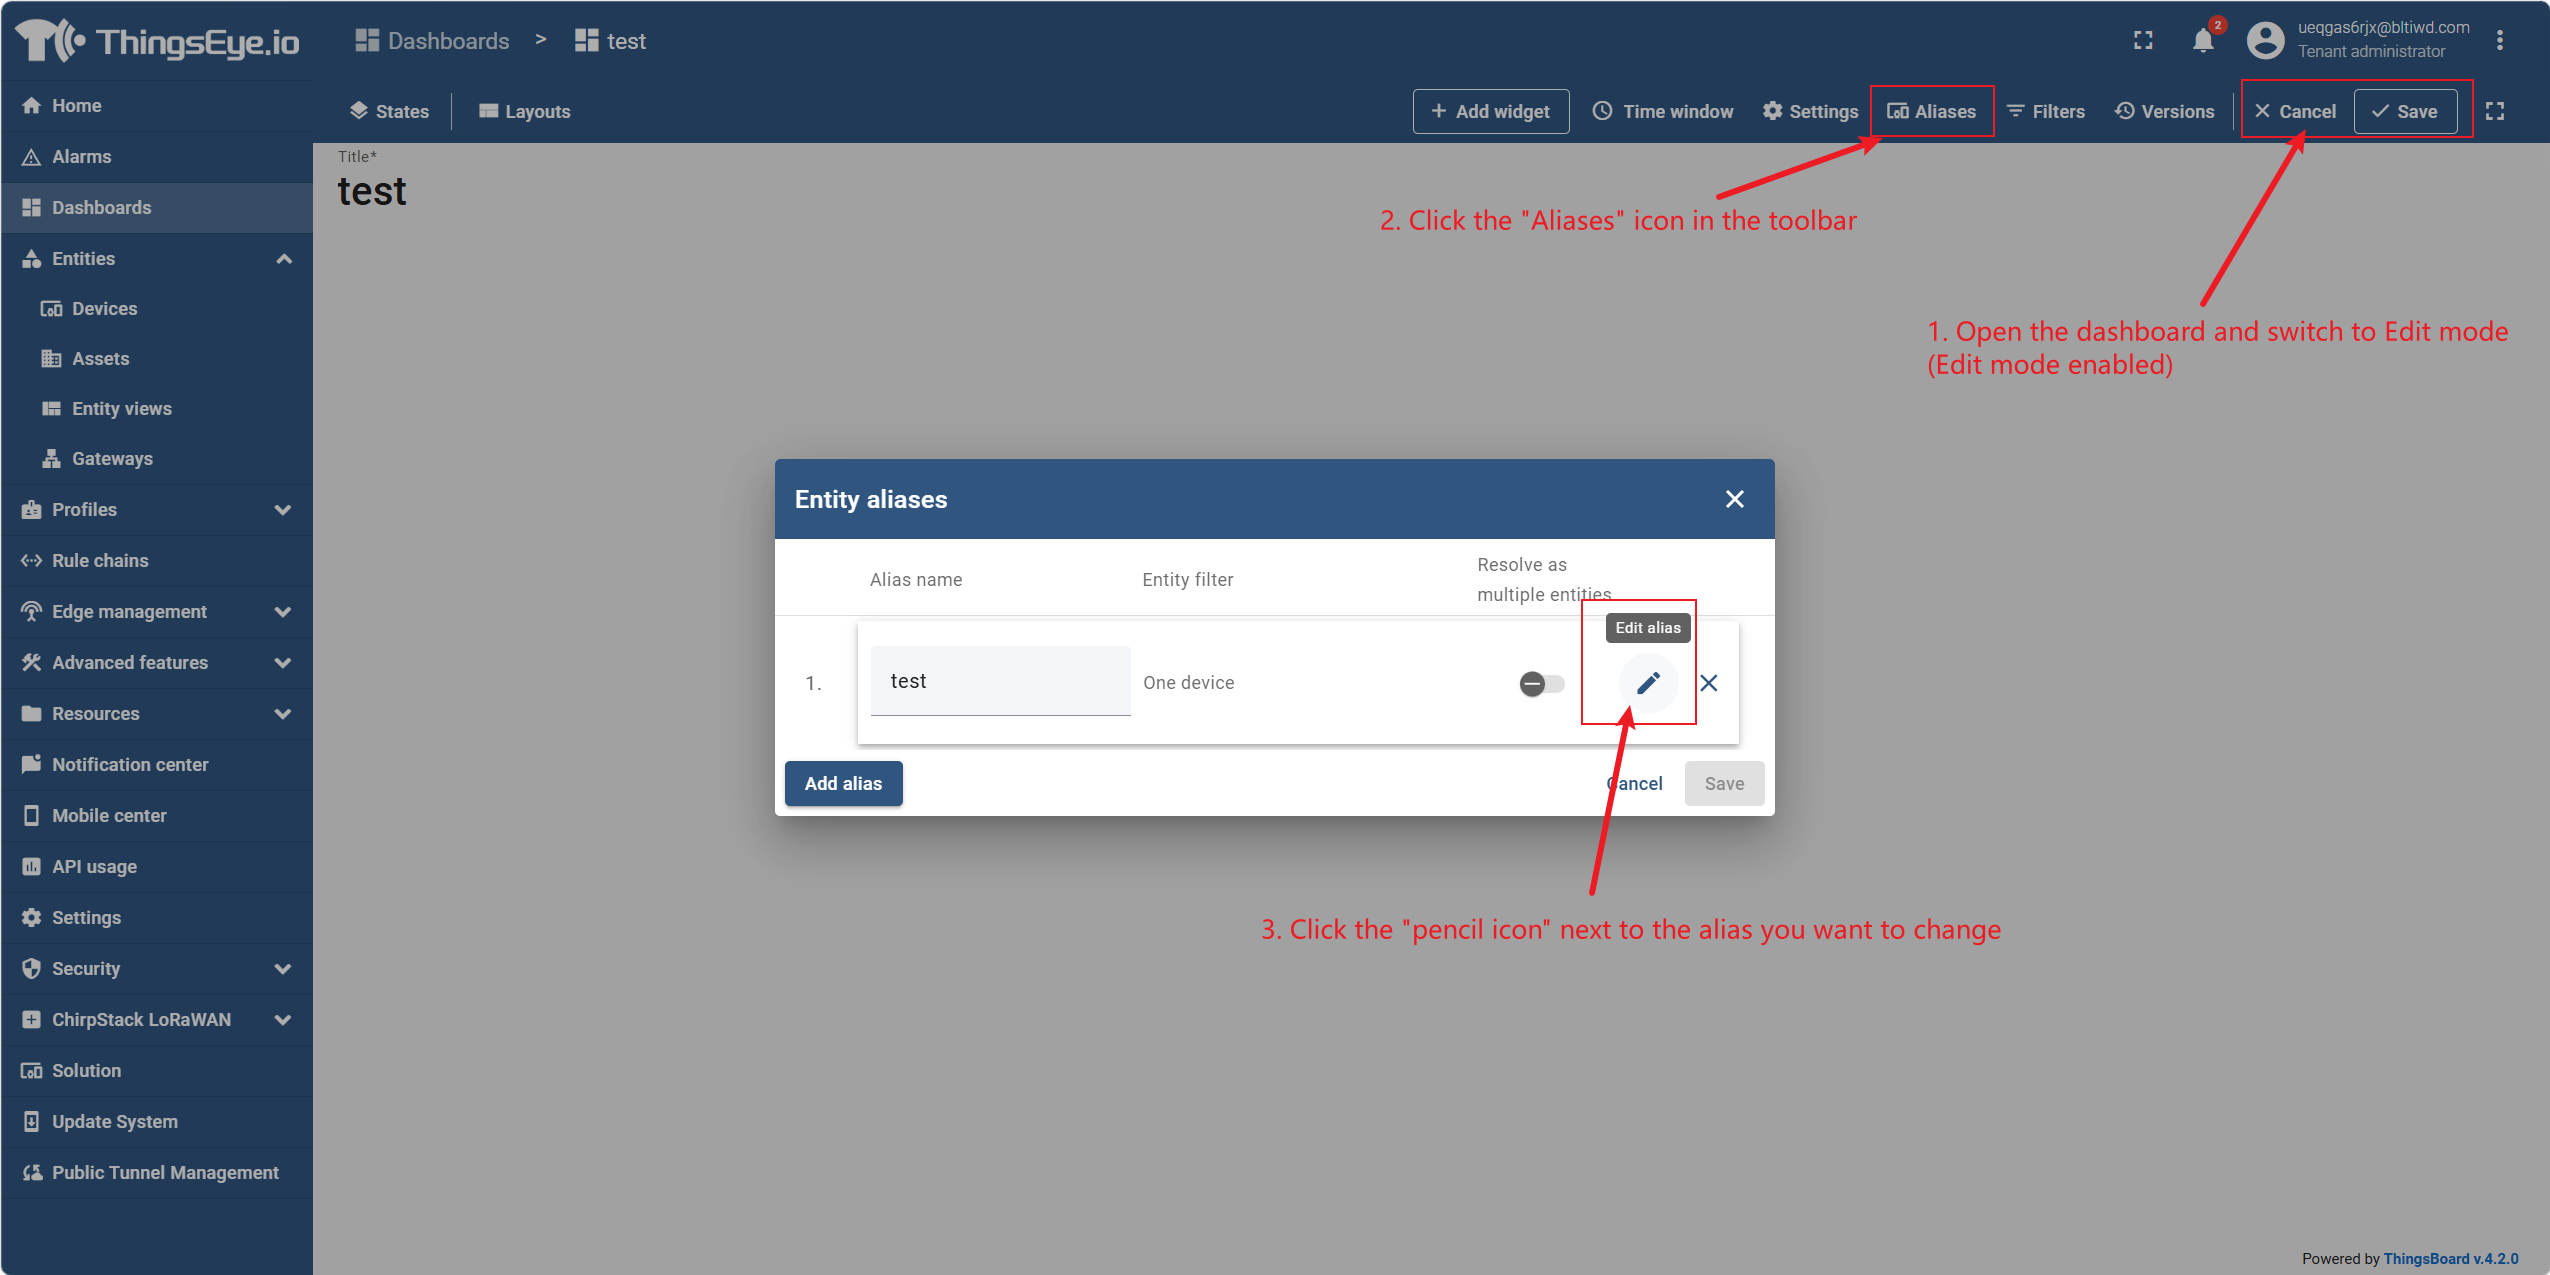
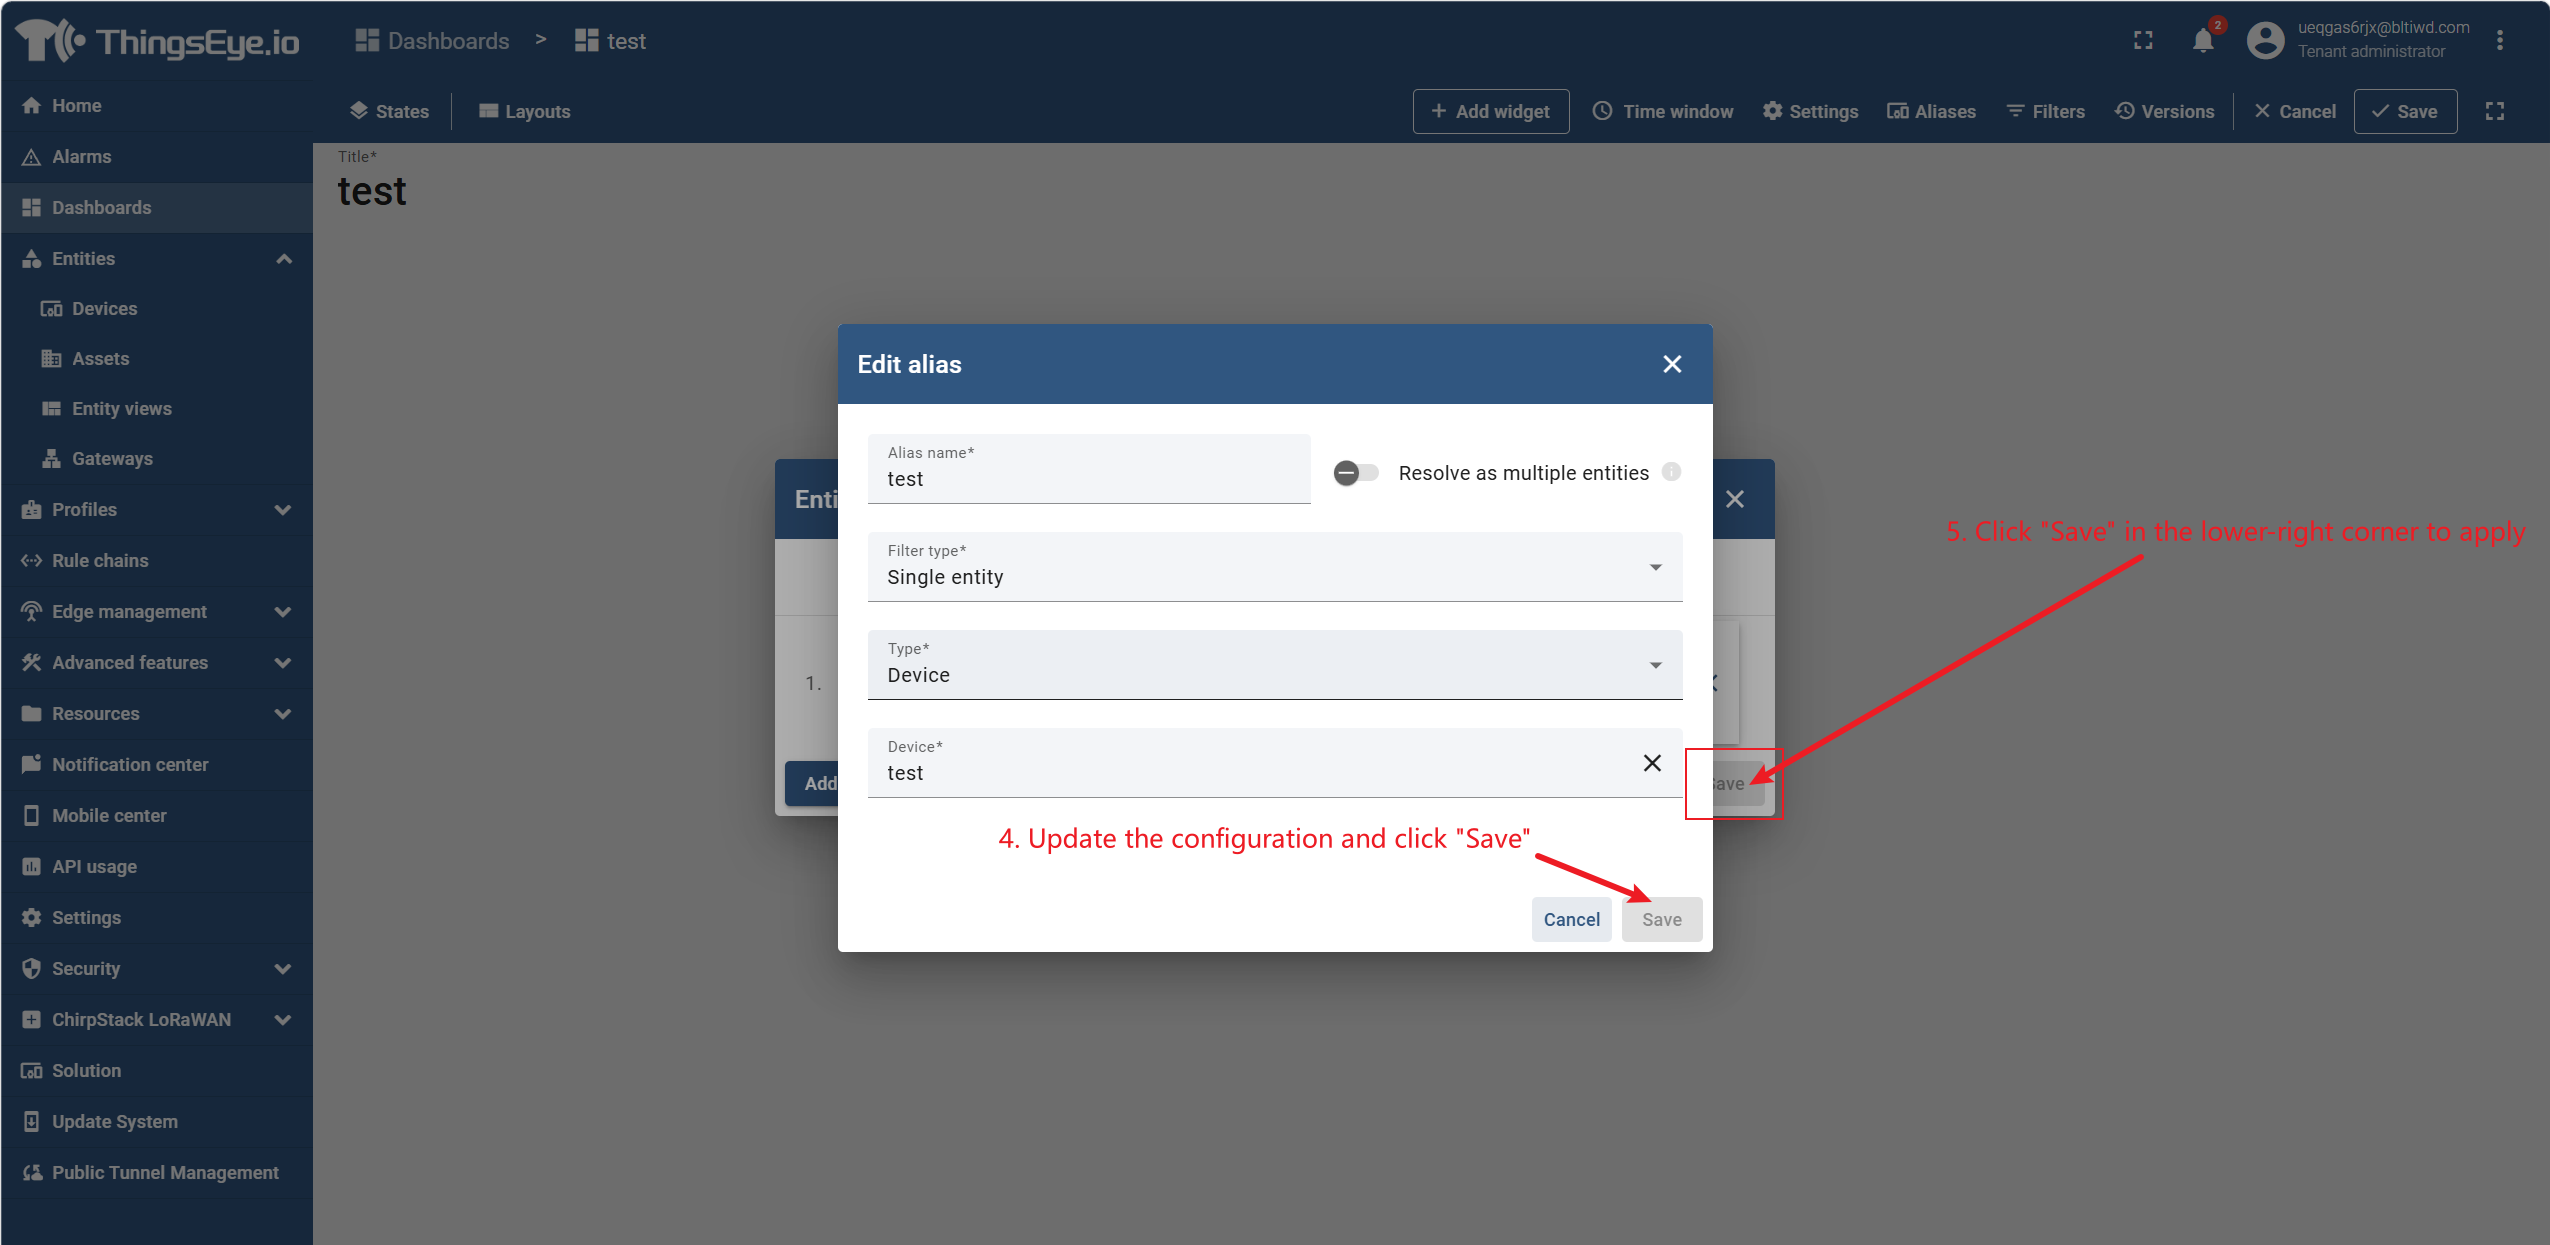
Edit an alias:
- Open the dashboard and switch to edit mode.
- Click the "Entity Aliases" icon in the toolbar.
- Click the pencil icon next to the alias you want to change.
- After updating the configuration, click "Save".
- Click "Save" in the lower‑right corner to apply.
Delete an alias:
- Open the dashboard and switch to edit mode.
- Click the "Entity Aliases" icon in the toolbar.
- Click "Remove Entity Alias" next to the alias to remove and confirm.
- Click "Save" in the lower‑right corner to apply.
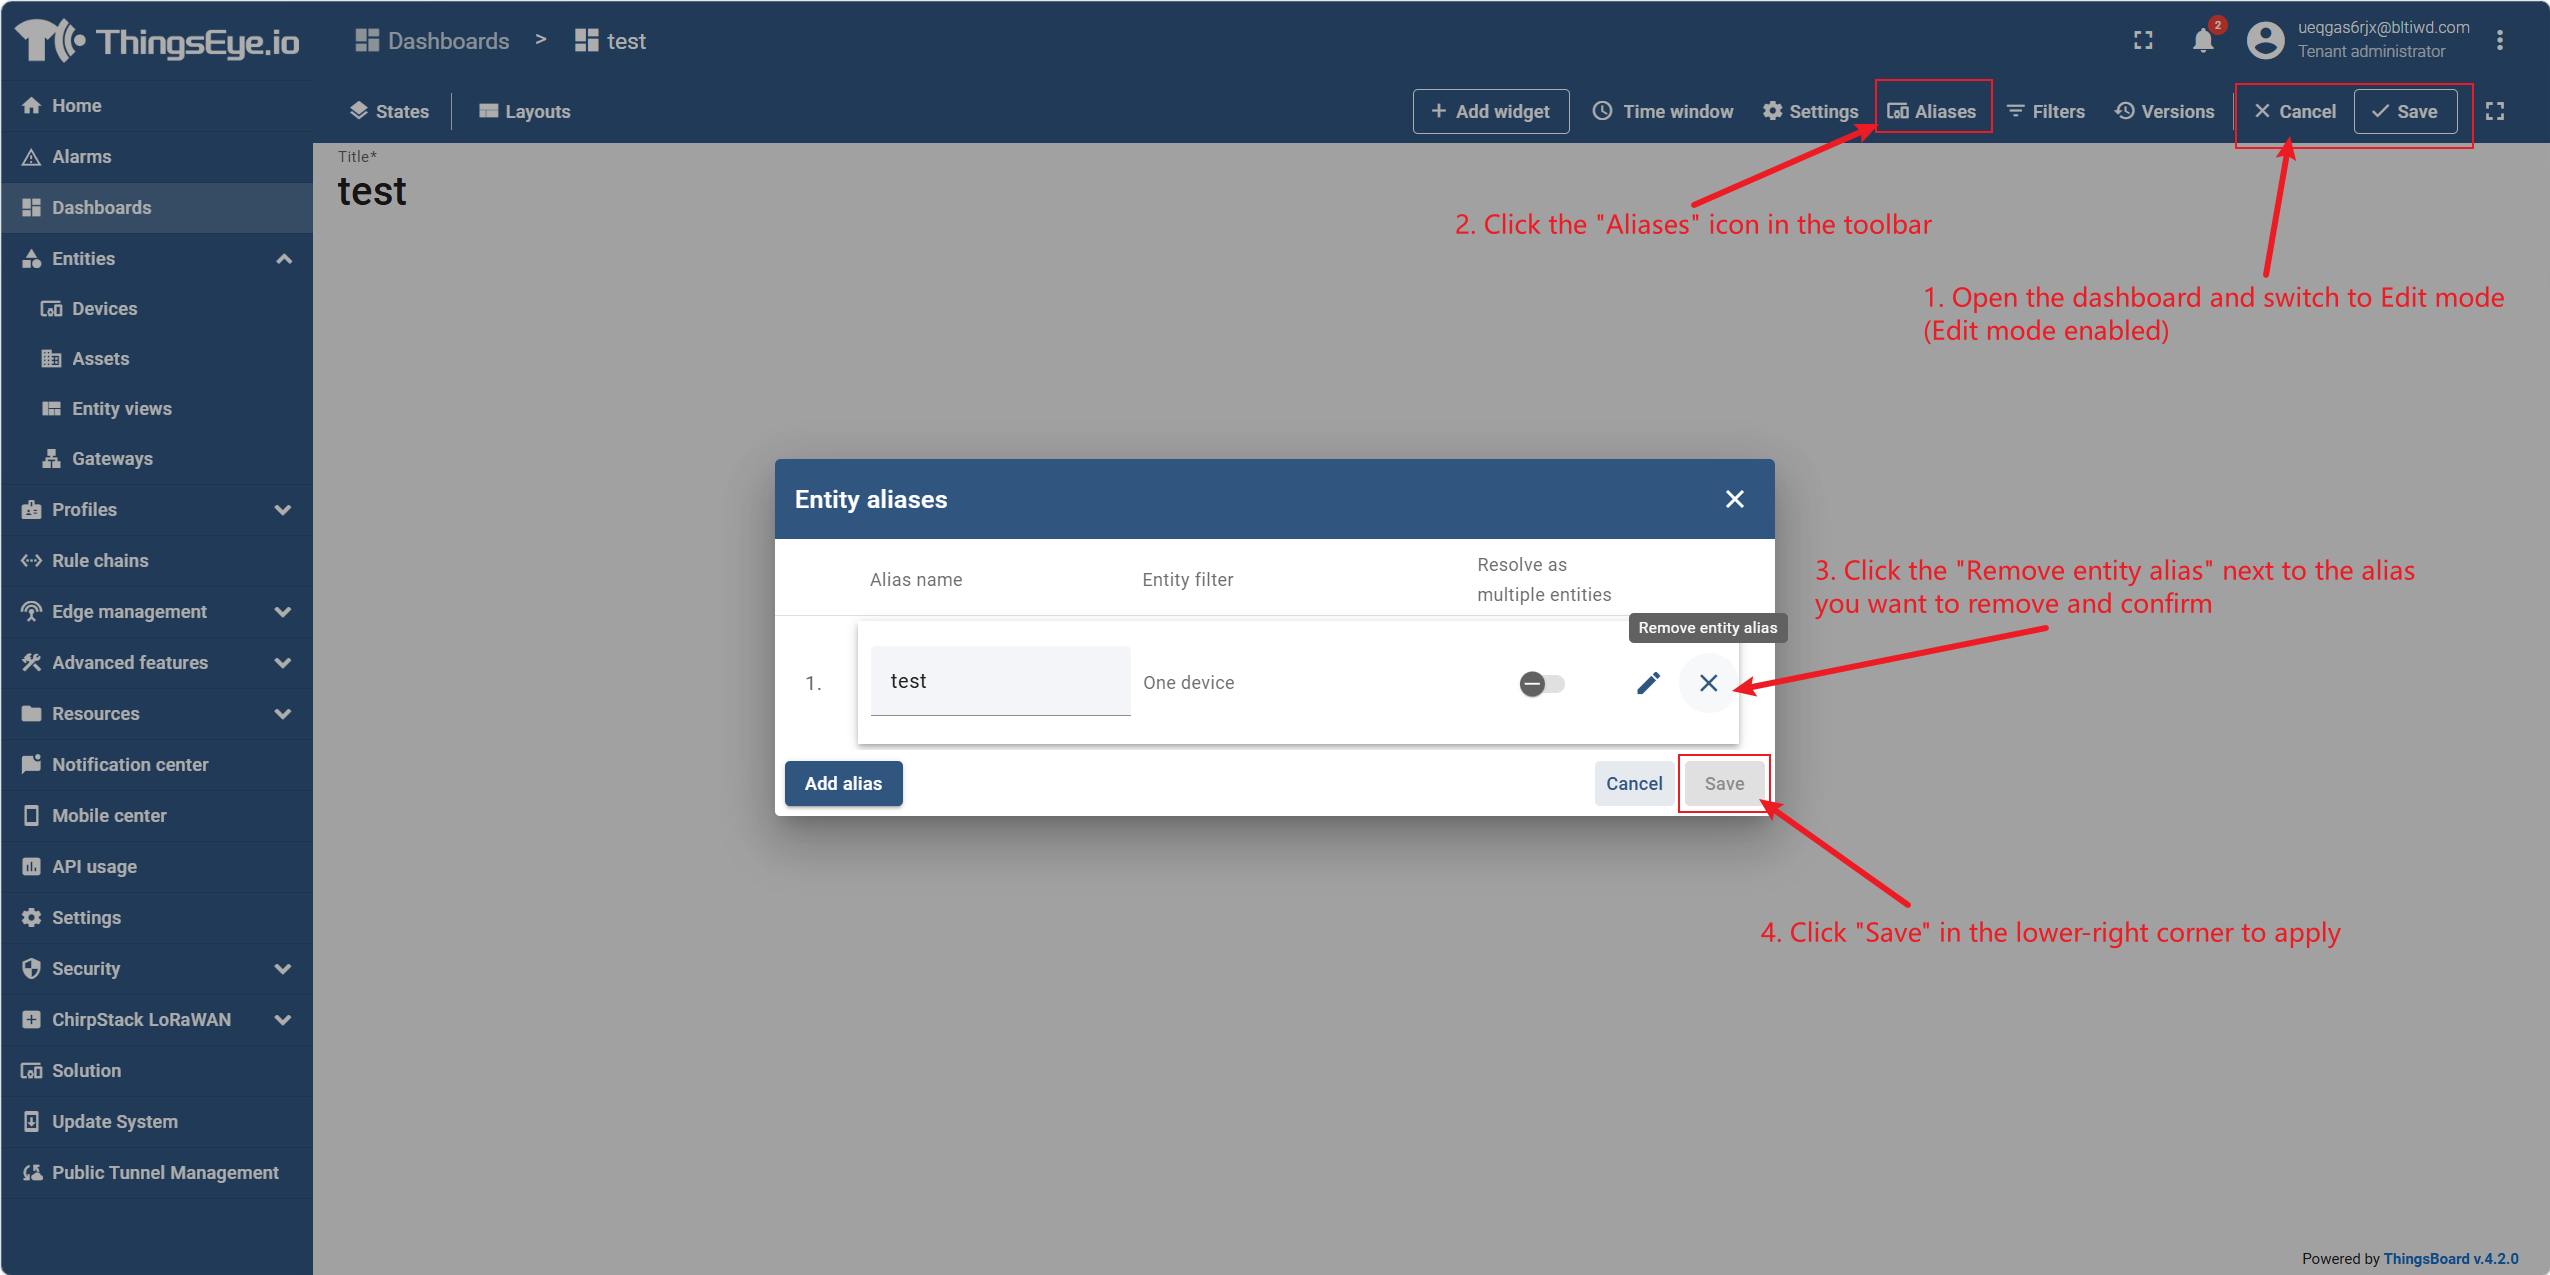
Before deleting an alias, confirm that it is not used by any widget; otherwise, the widget will lose its data source.
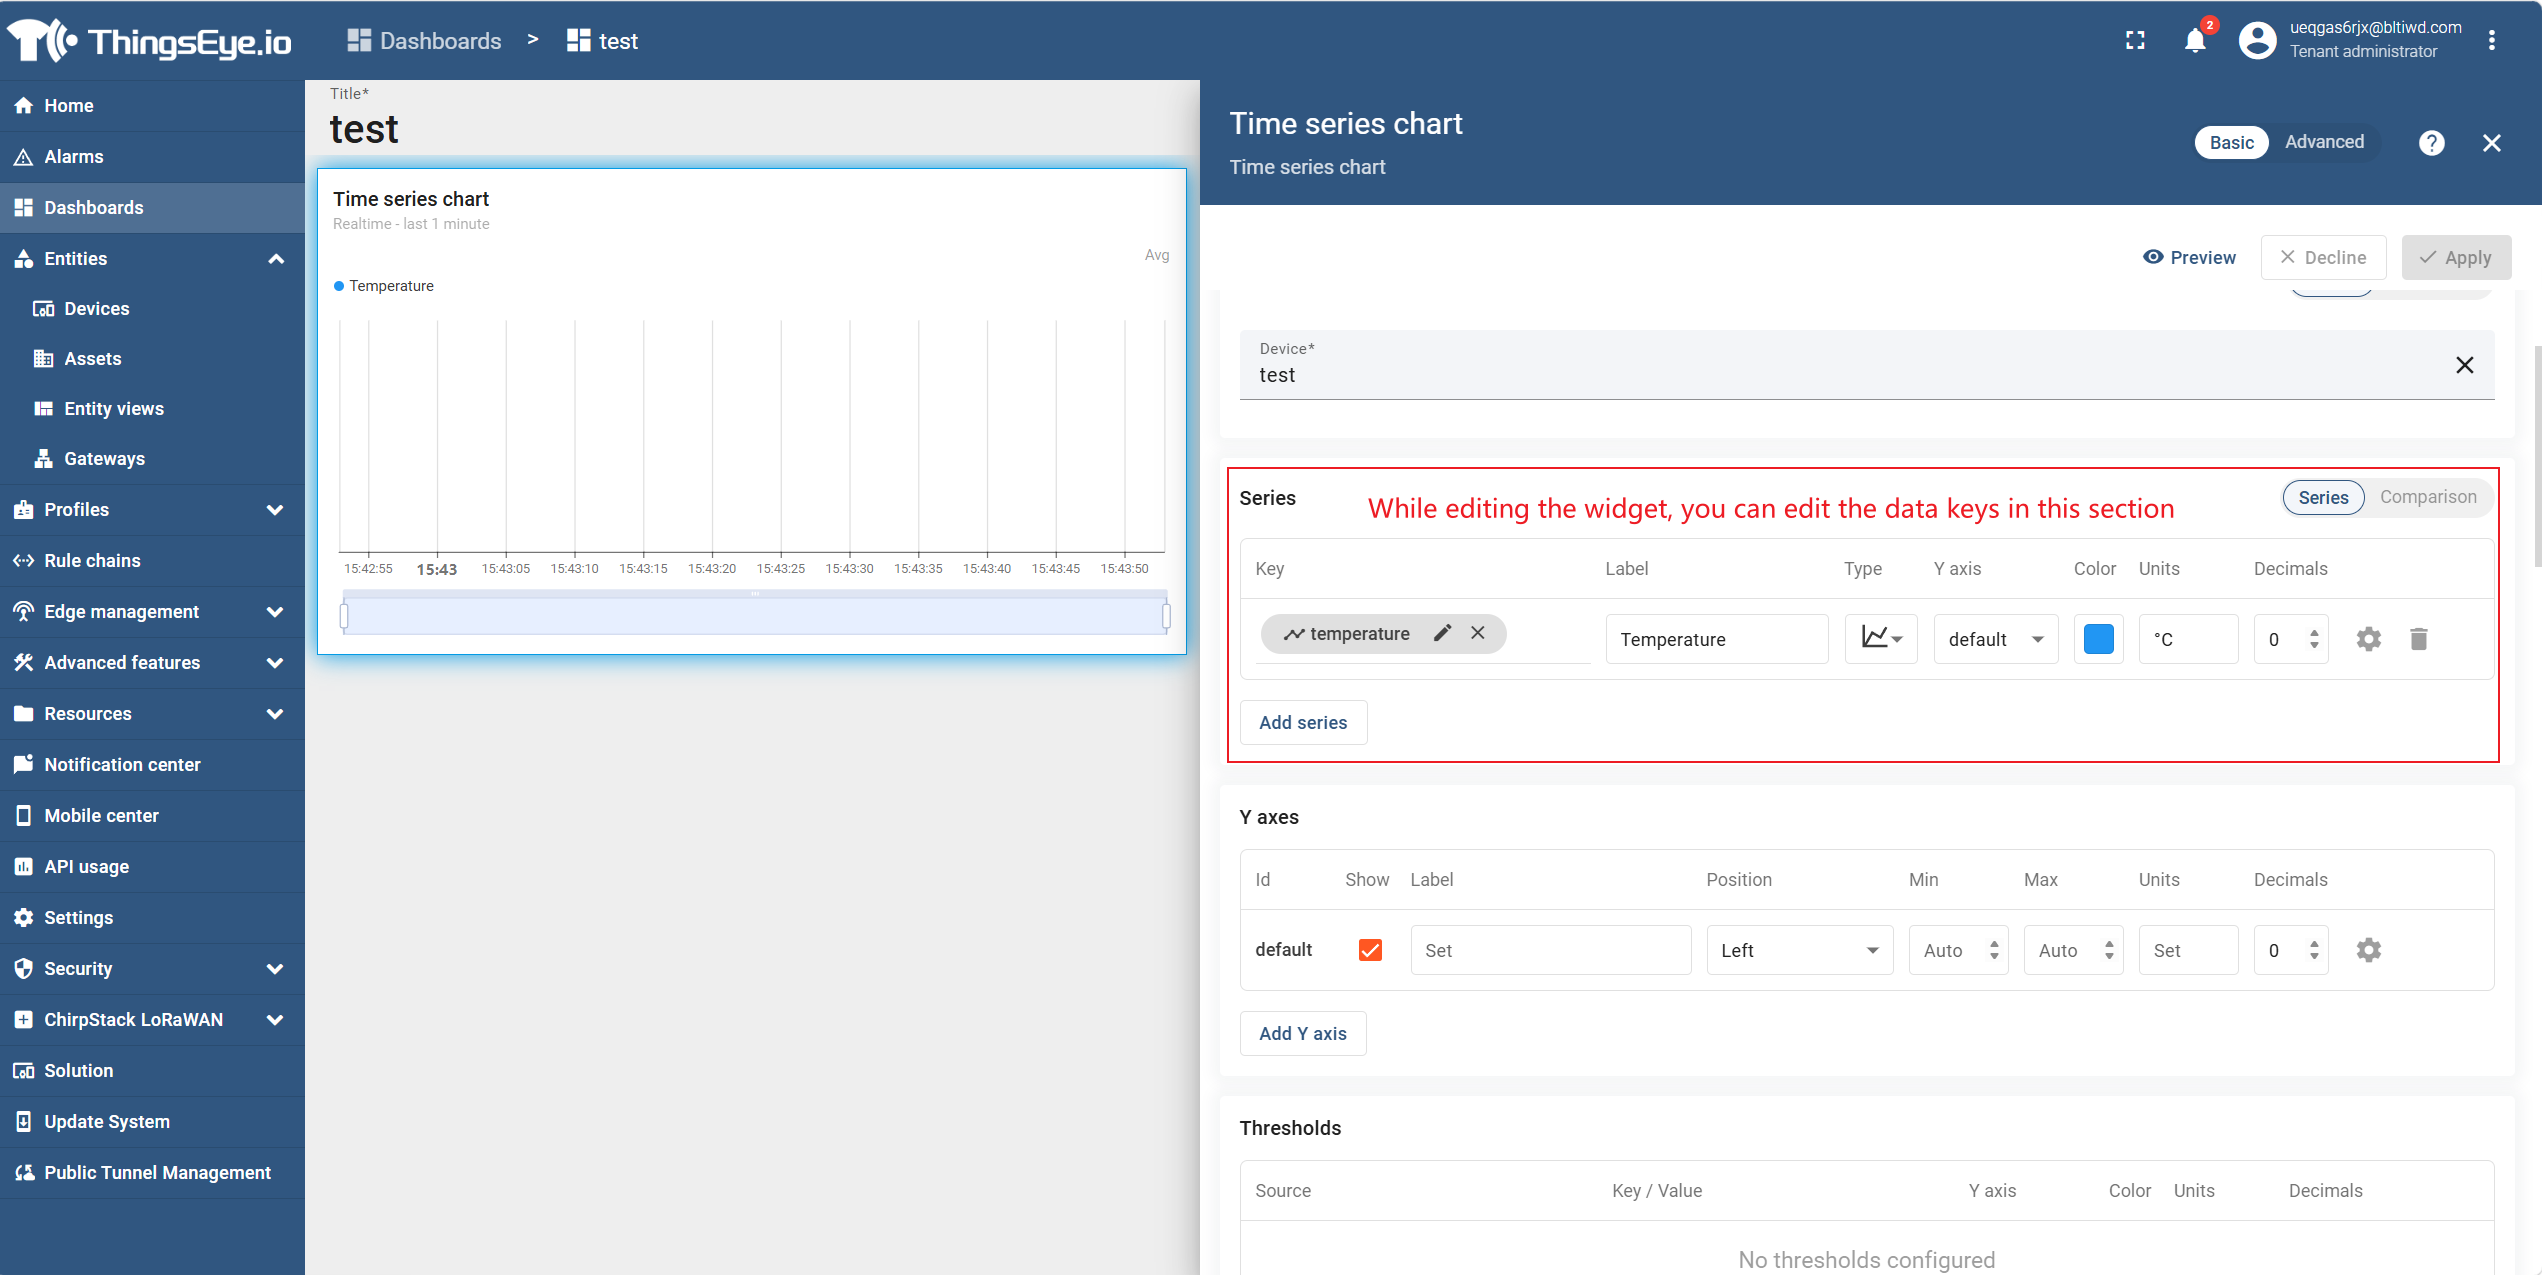
Step 5: Configure data keys
A data key identifies the telemetry, attribute, or entity field that a widget reads from its data source. Each data source can contain multiple data keys.
Data key source types:
| Source Type | Description | Applicable Widget Types |
|---|---|---|
| Time Series | Telemetry keys reported by devices (e.g., temperature, humidity) | Time‑series widgets |
| Attribute | Client‑side, server‑side, or shared attributes of an entity | Latest‑value widgets |
| Entity Field | Metadata fields of an entity type (e.g., name, type, label, created time) | Latest‑value widgets |
| Alarm Field | Alarm‑related fields (e.g., severity, status, type) | Alarm widgets |
Add a data key:
- In the data source section of the "Add Widget" dialog, click the data key input field.
- Select an existing key from the dropdown list; if the key does not yet exist, manually enter a name and select the source type.
- Configure the label, unit, and decimal places for each data key.
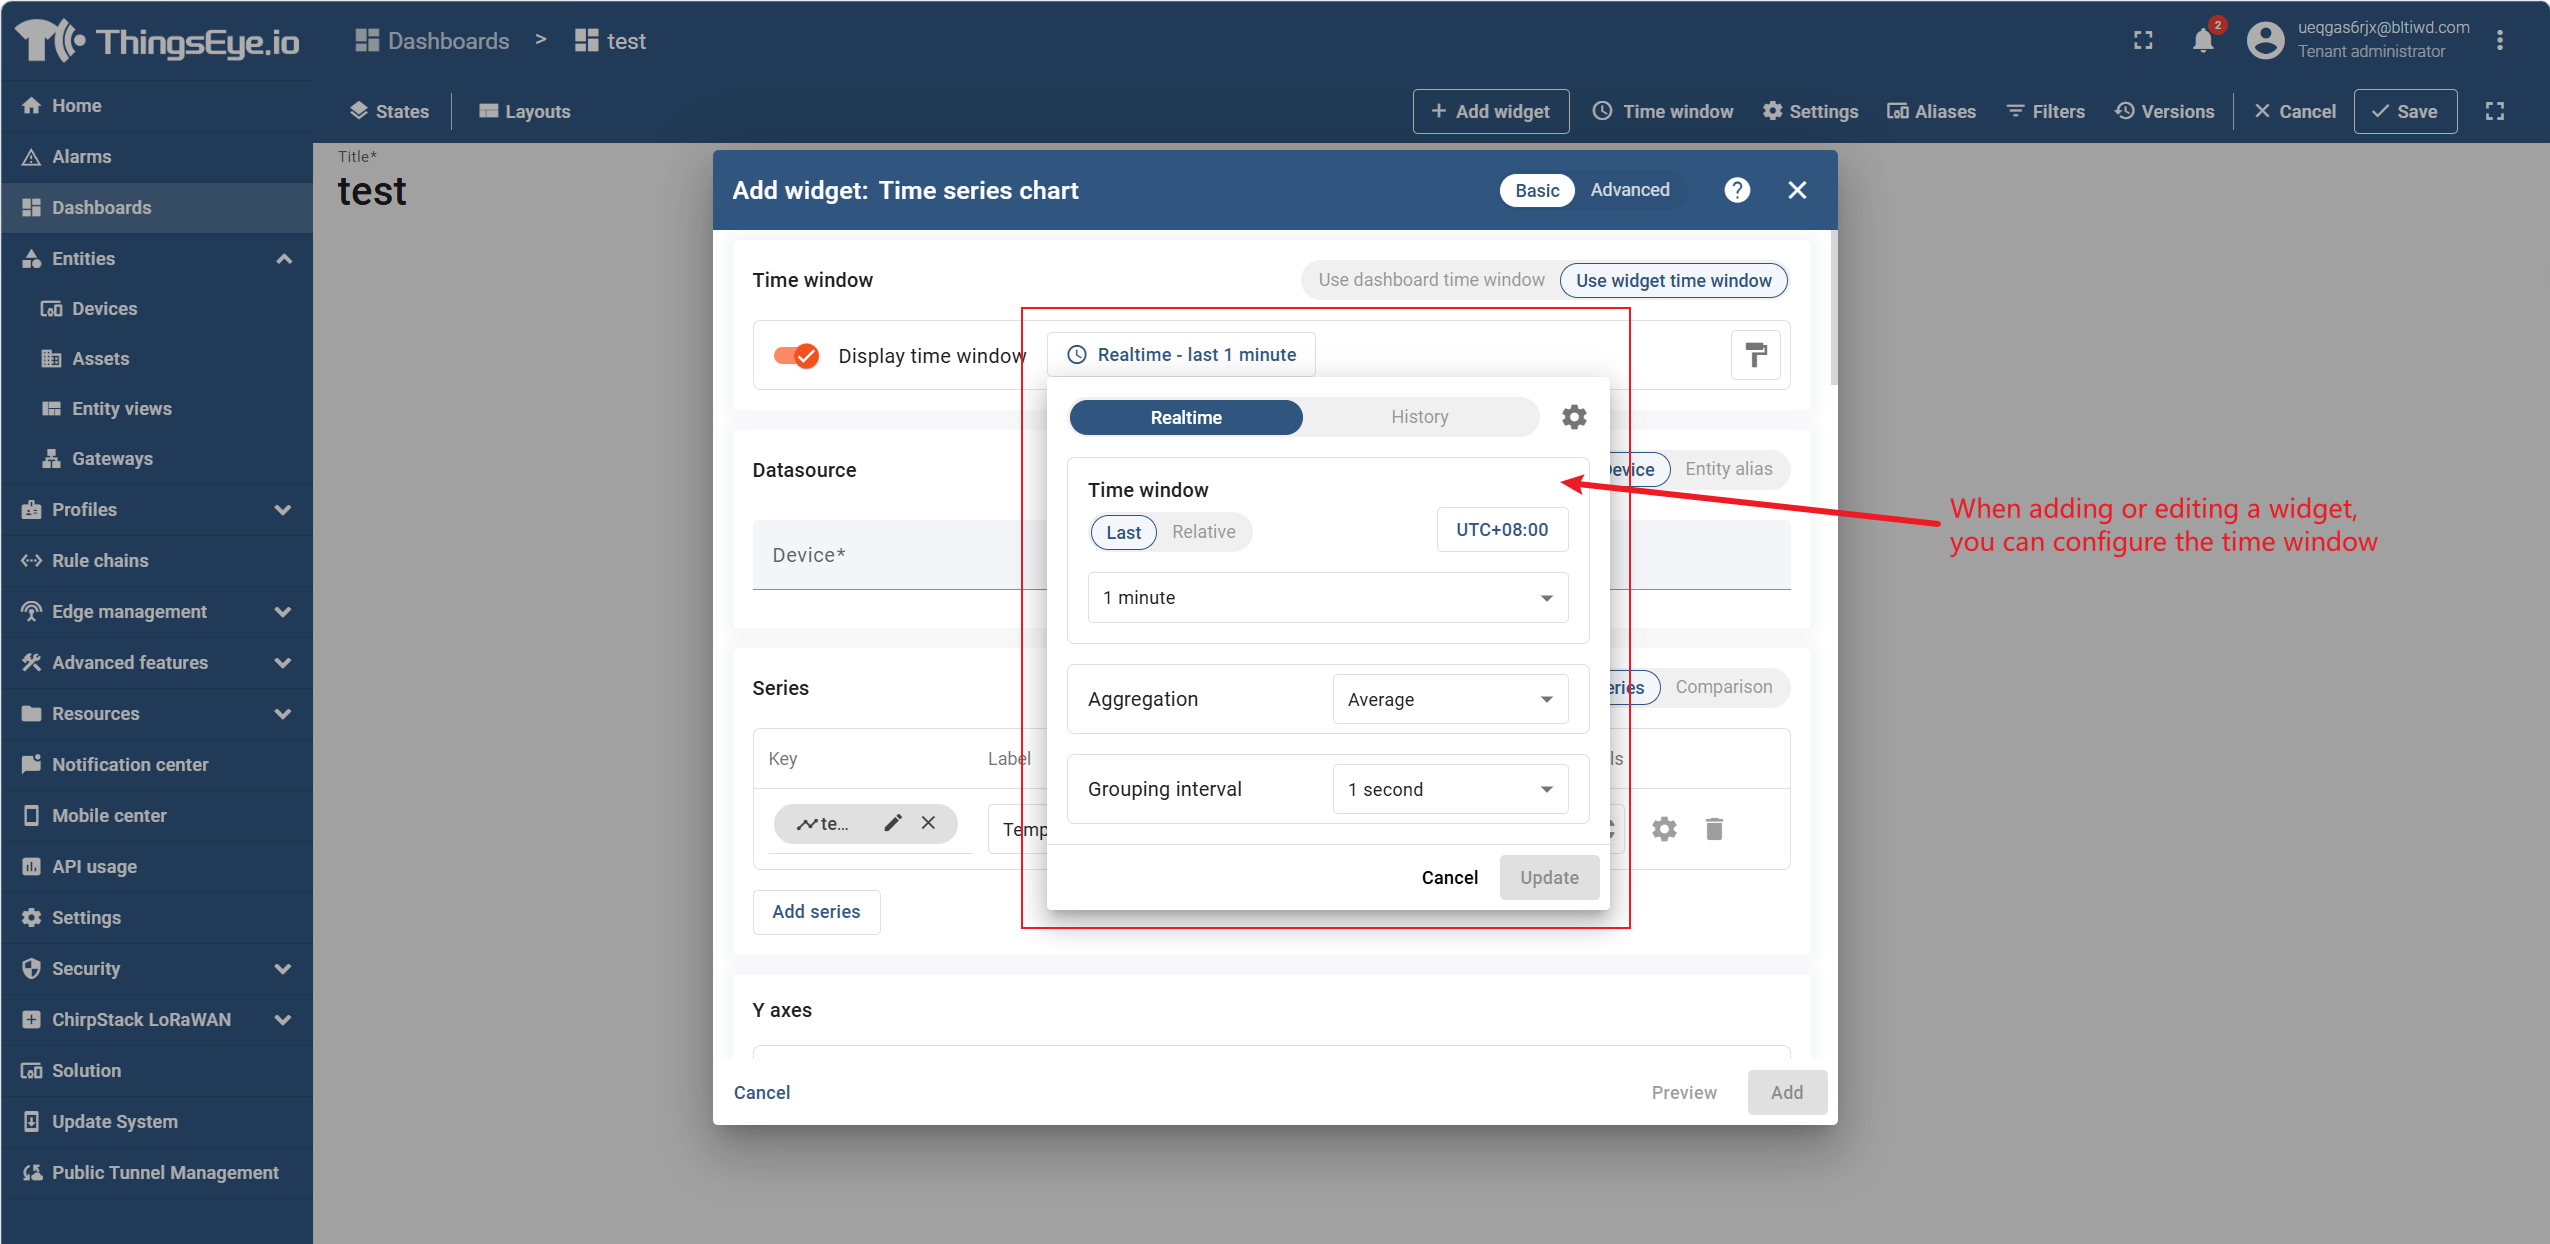
Step 6: Configure the time window
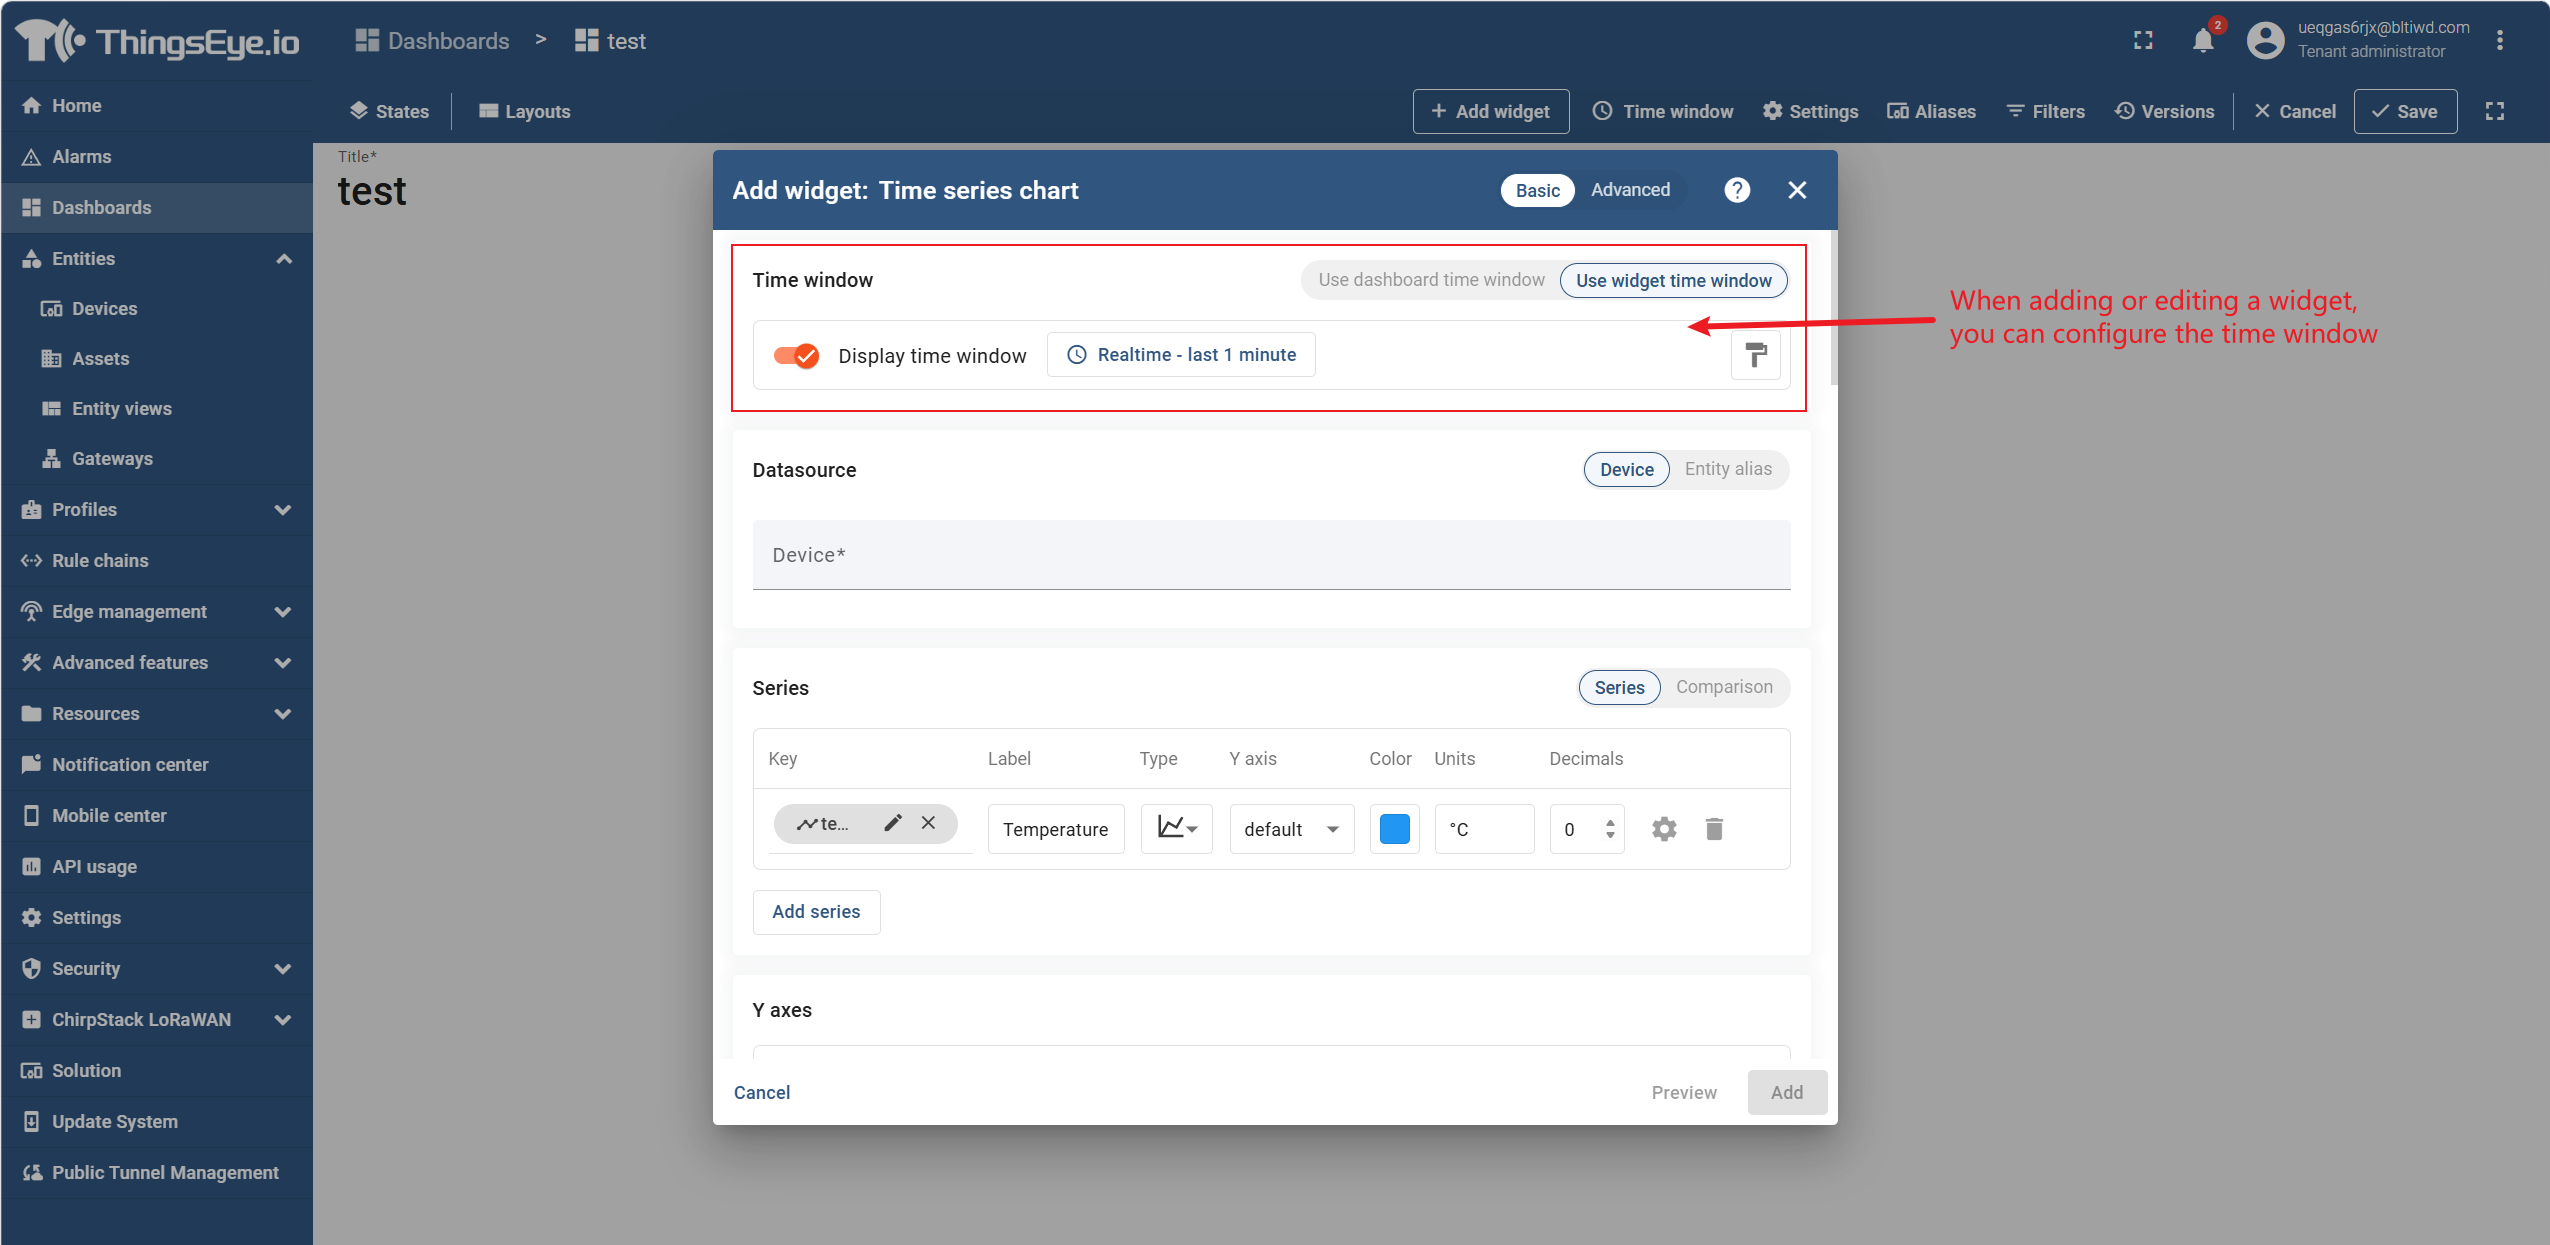
Time‑series widgets (such as time‑series charts and time‑series tables) require a time window configuration that defines the time range of the displayed data.
| Time Window Type | Description |
|---|---|
| Live | Continuously updates; new data is automatically displayed as it arrives |
| Last N | Relative time range, e.g., "Last 24 hours", "Last 7 days" |
| Custom | Absolute date/time range |
Configure aggregation: time‑series data is grouped and aggregated at selected intervals (e.g., hourly, daily). Supported functions: Average, Sum, Min, Max, Count.
4. Delete a Dashboard
Procedure
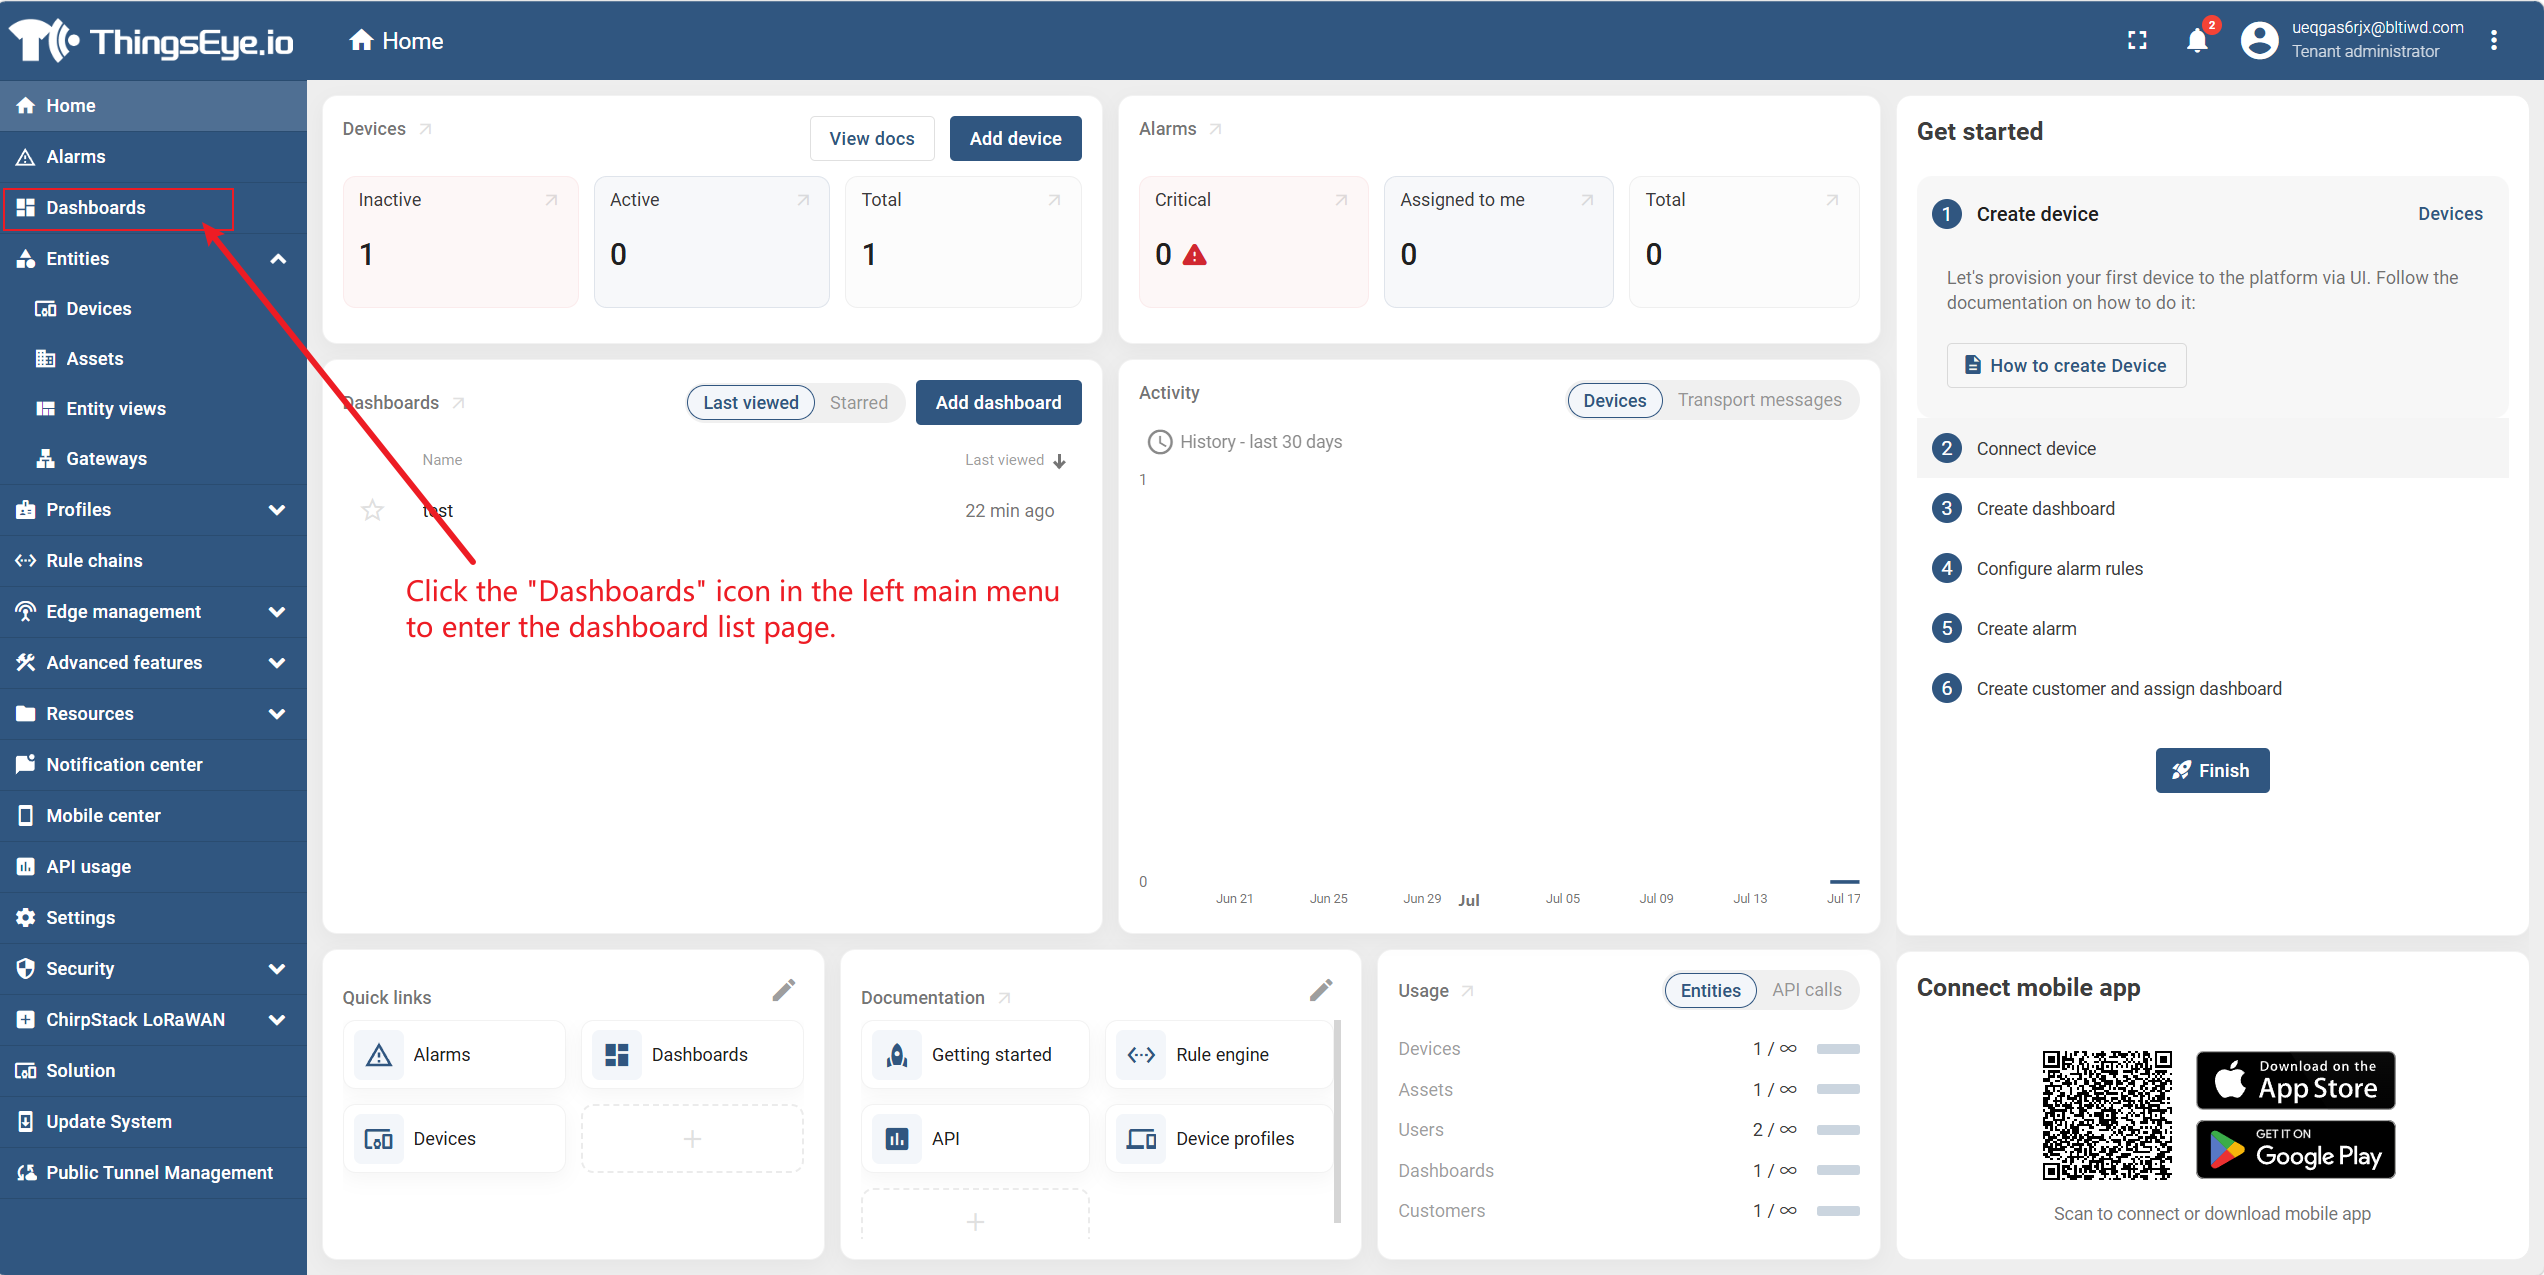
Step 1: Go to the dashboard list page
Click the "Dashboards" icon in the left main menu to go to the dashboard list page.
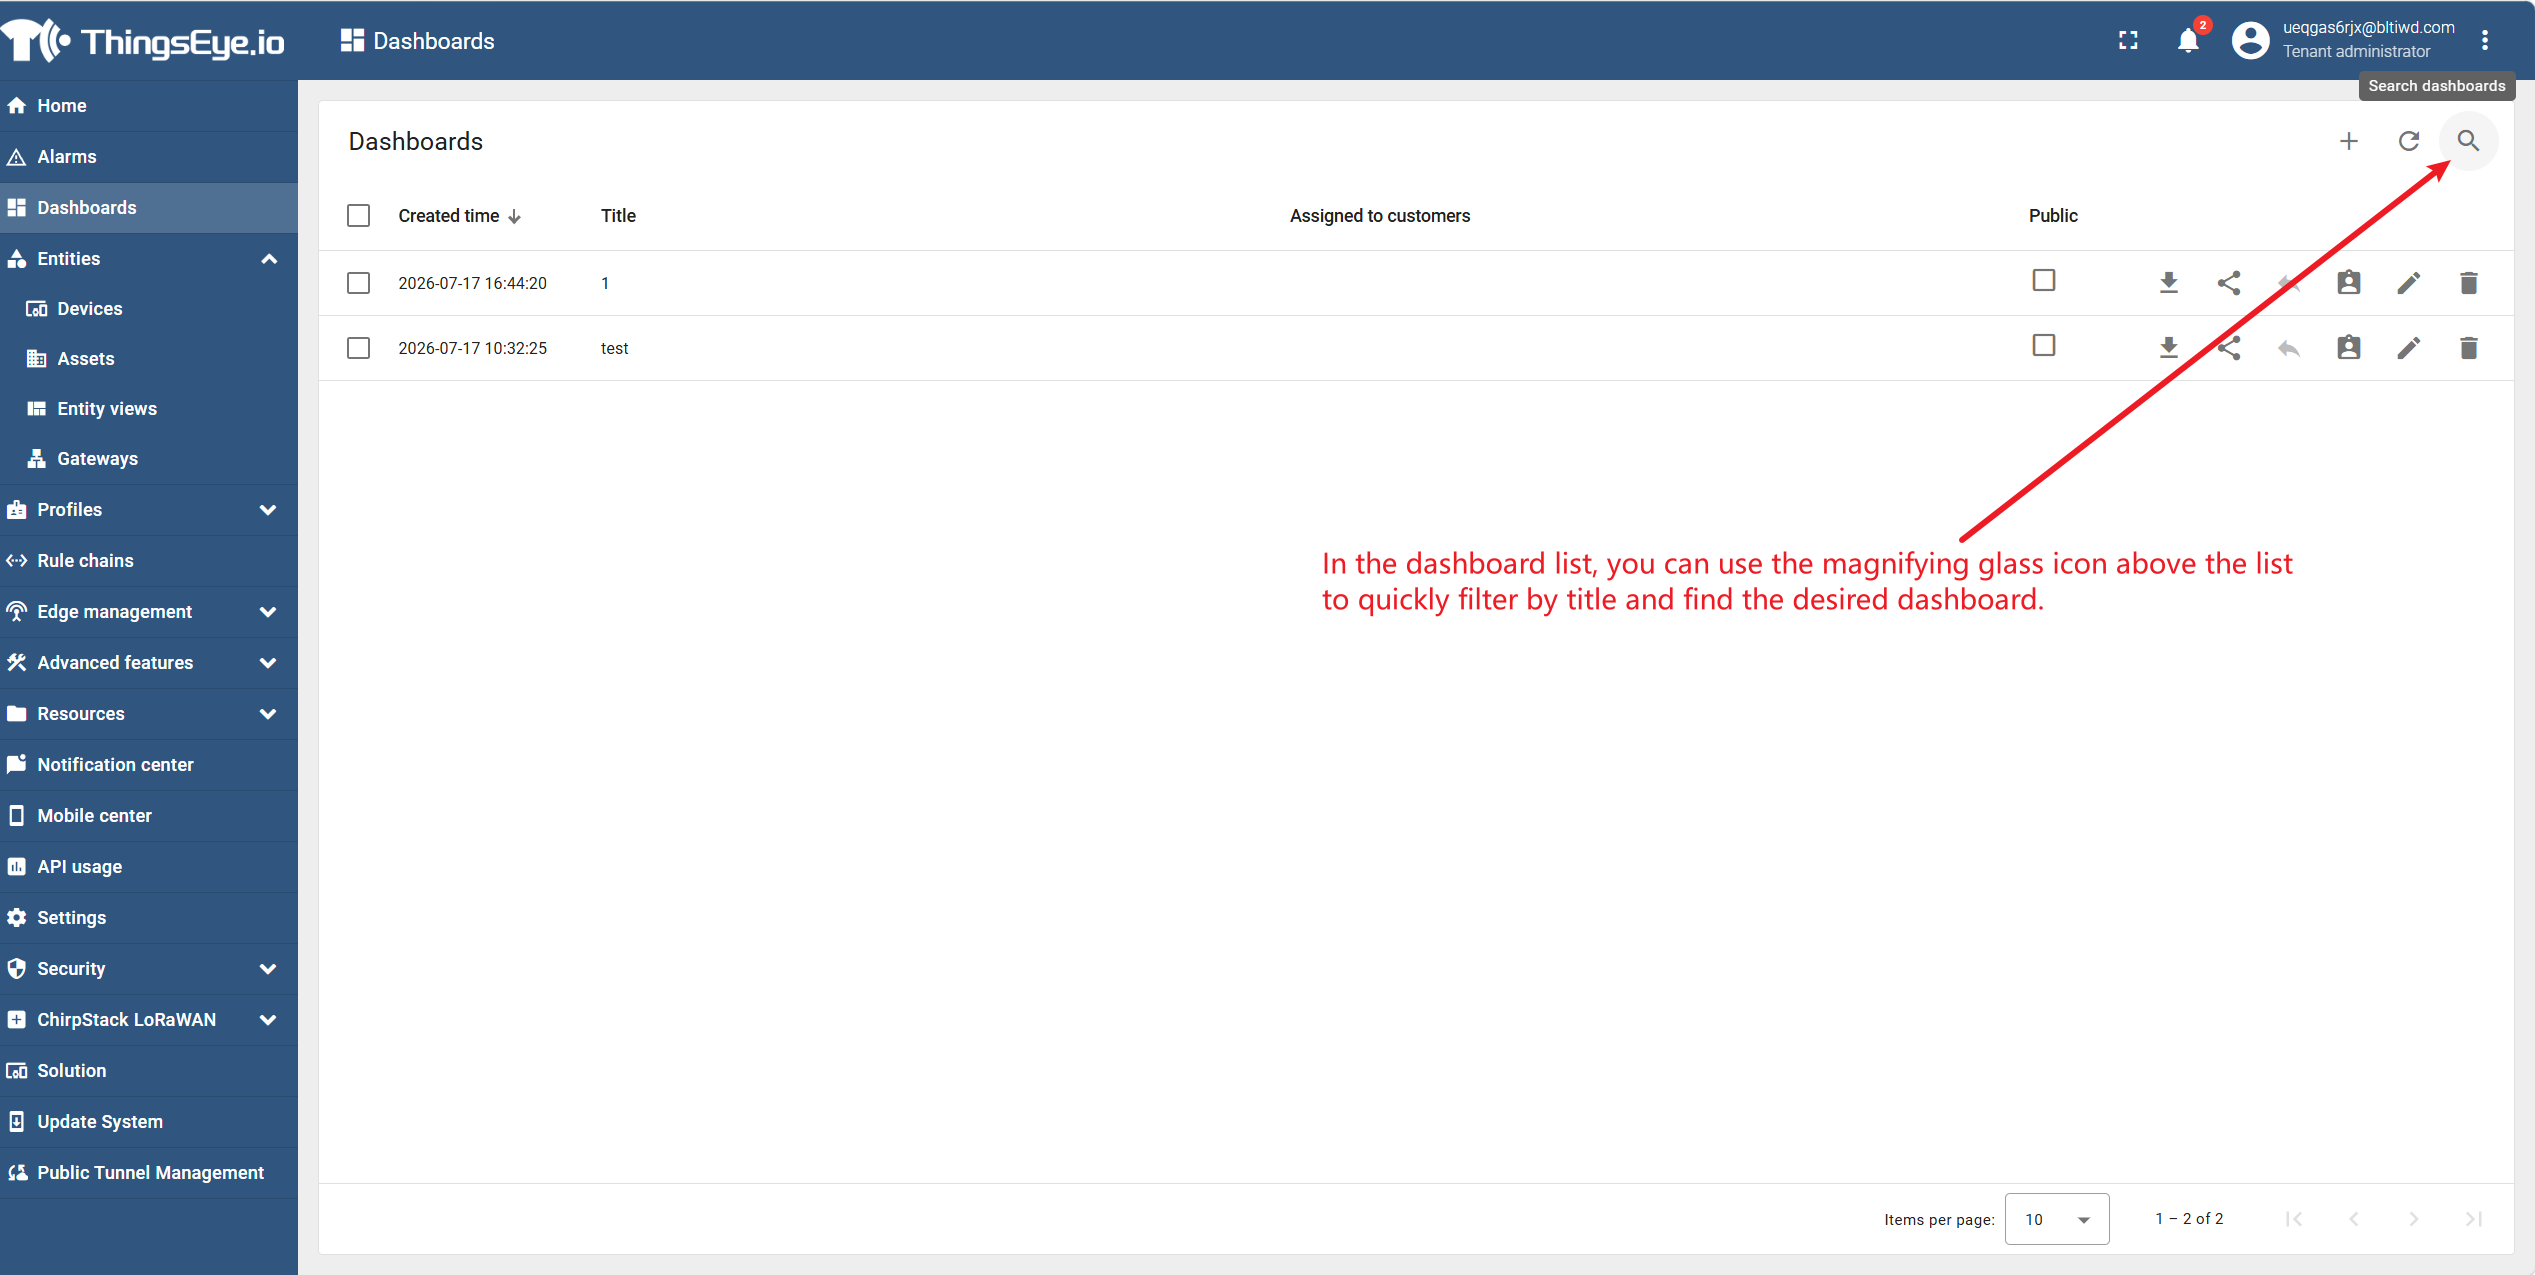
Step 2: Locate the target dashboard
In the dashboard list, use the magnifying glass icon above the list to quickly filter by title and find the desired dashboard.
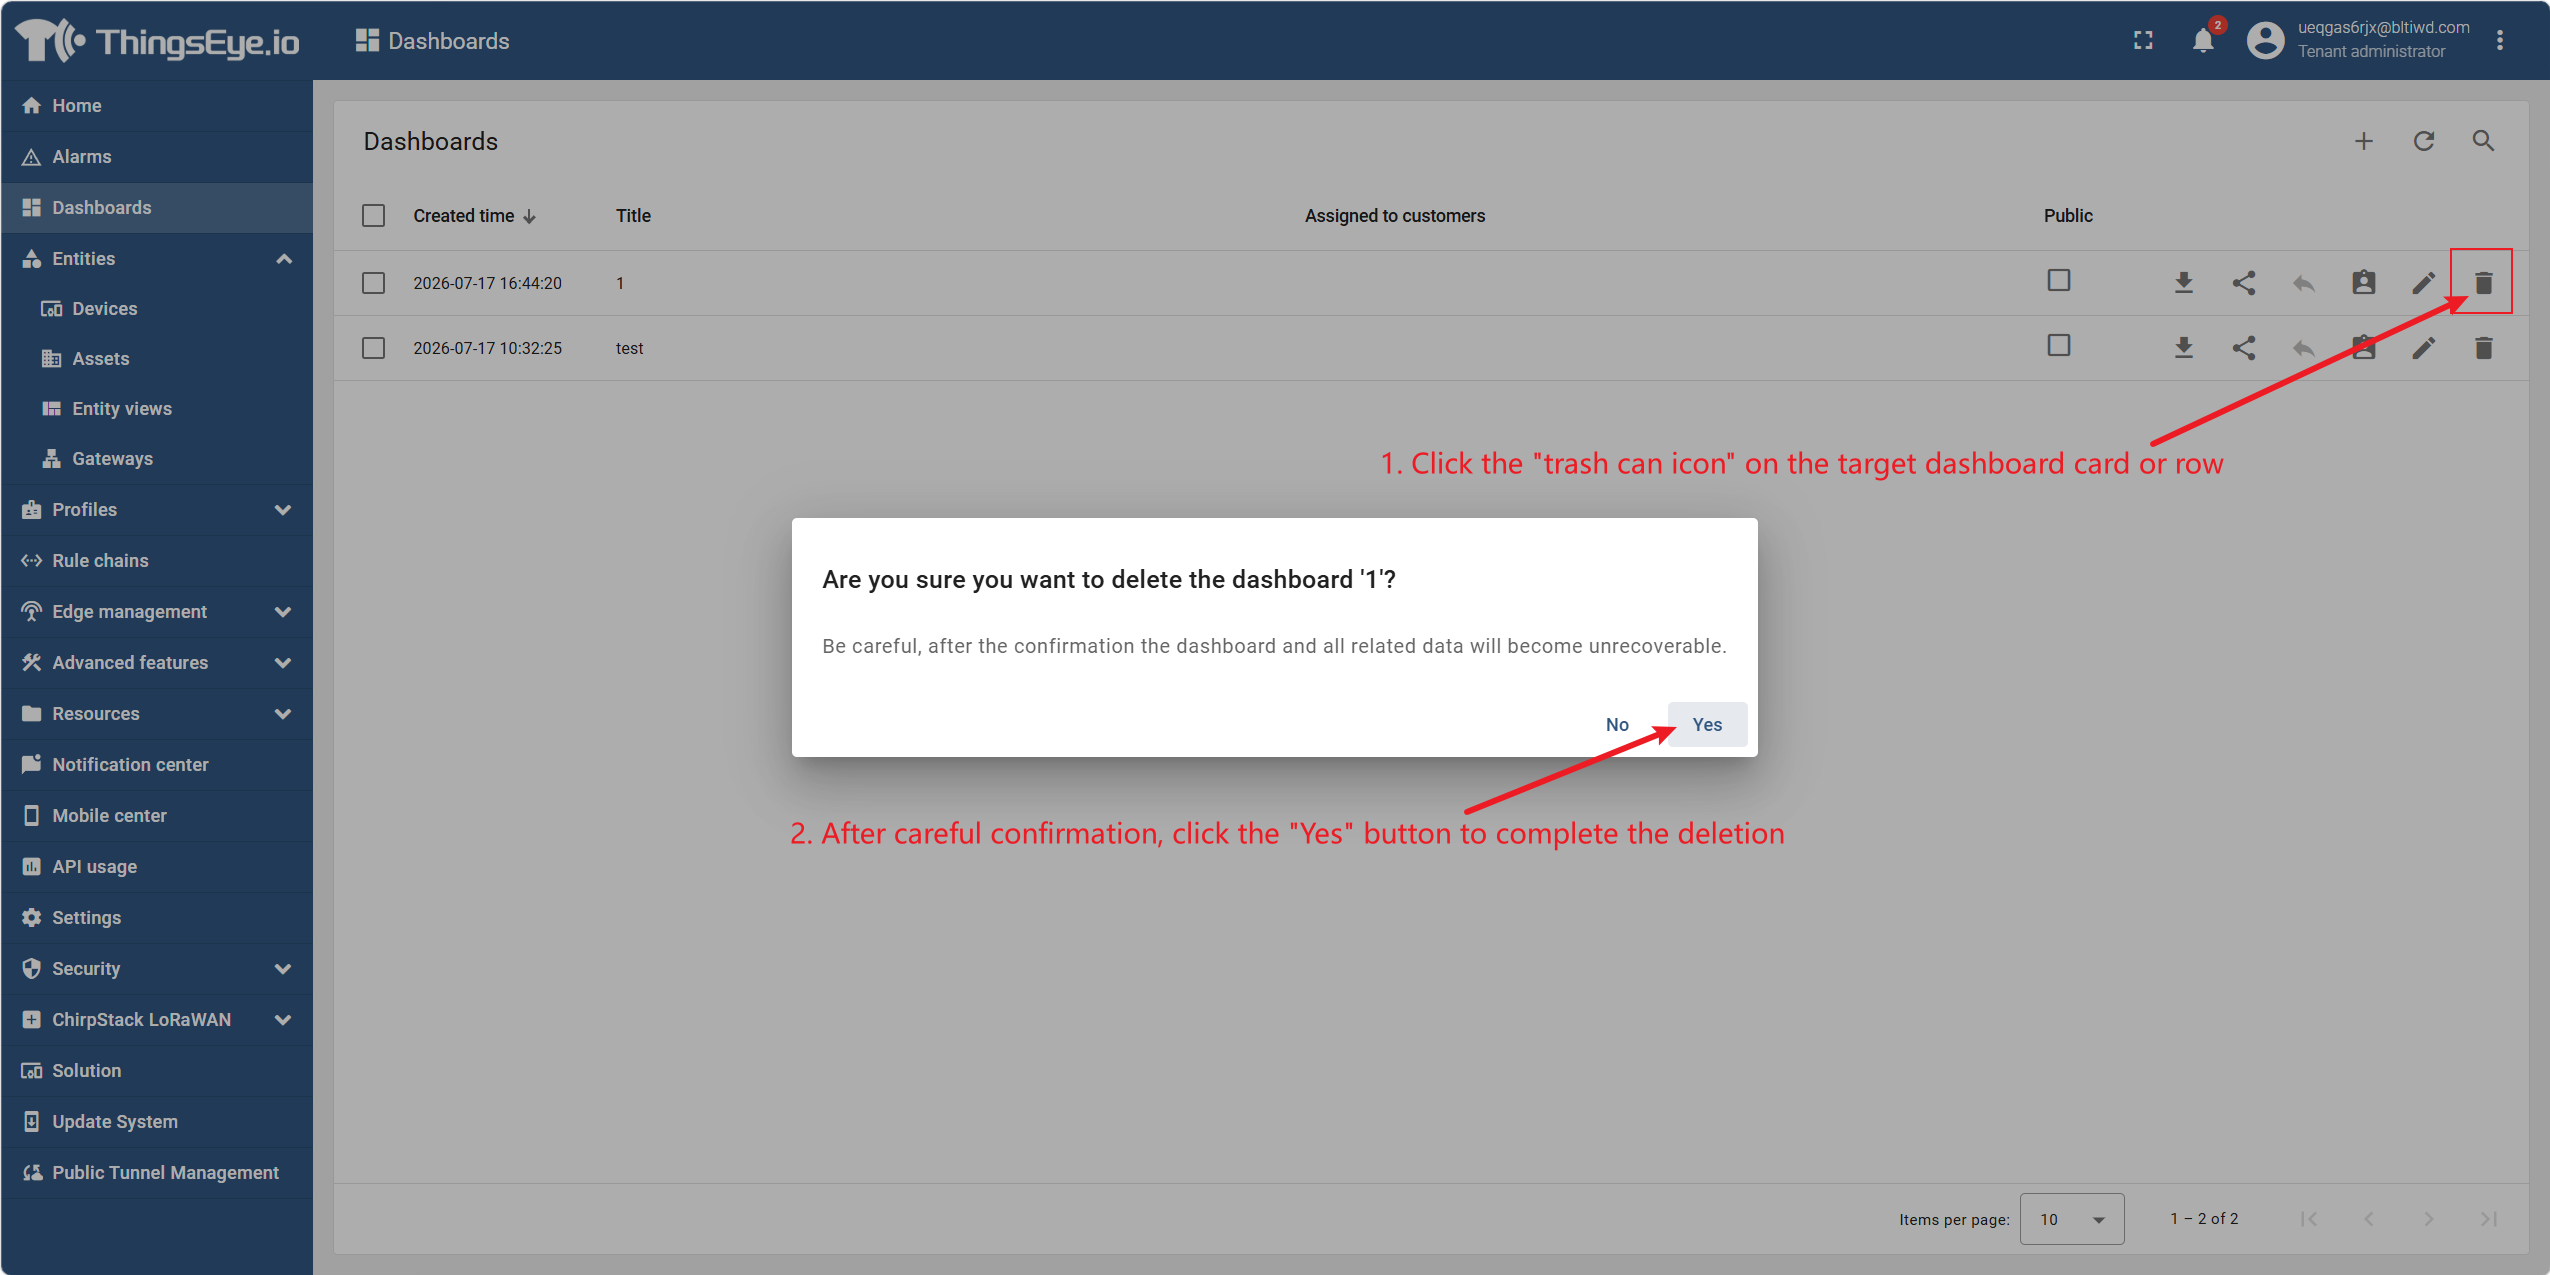
Step 3: Perform the deletion operation
Click the trash can icon on the target dashboard card or row. The system displays a confirmation dialog indicating that this operation is irreversible. After careful confirmation, click the "Yes" button to complete the deletion.
If the dashboard has been shared with End‑Users, it is recommended to revoke all sharing configurations before deletion; otherwise, invalid entries may appear in the dashboard lists of those End‑Users.
Step 4: Confirm the deletion result
After successful deletion, the dashboard is removed from the list and no longer displayed. If deletion fails, the system will display an error message; adjust according to the prompt and try again.
Considerations
- Deletion is irreversible: Deleted dashboards cannot be recovered; proceed with caution. If you need to retain the configuration, it is recommended to export the dashboard (if supported) or record its settings before deletion.
- Draft and published dashboards: The deletion operation is the same for both; neither can be recovered after deletion.
- Shared dashboards: Before deletion, confirm that the dashboard is not being used by any End‑User, or notify the relevant users in advance.
- Associated data is not affected: Deleting a dashboard does not delete its data sources (devices, assets, etc.); it only deletes the dashboard itself.
5. Publish and Share Dashboards
ThingsEye provides two ways to share dashboards with users:
| Sharing Method | Description | Use Case |
|---|---|---|
| Public | Generates a public link; anyone with the link can view the dashboard without logging in | Sharing data with external parties (e.g., customers, partners), or for large‑screen displays that do not require account registration |
| Assign to Customer | Assigns the dashboard to one or more customers; users under these customers can view it in their dashboard list after logging in | The platform already has a complete user system, requiring customer‑based data isolation and access control |
Method 1: Public
Procedure:
- Go to the "Dashboards" list page.
- Find the row of the target dashboard.
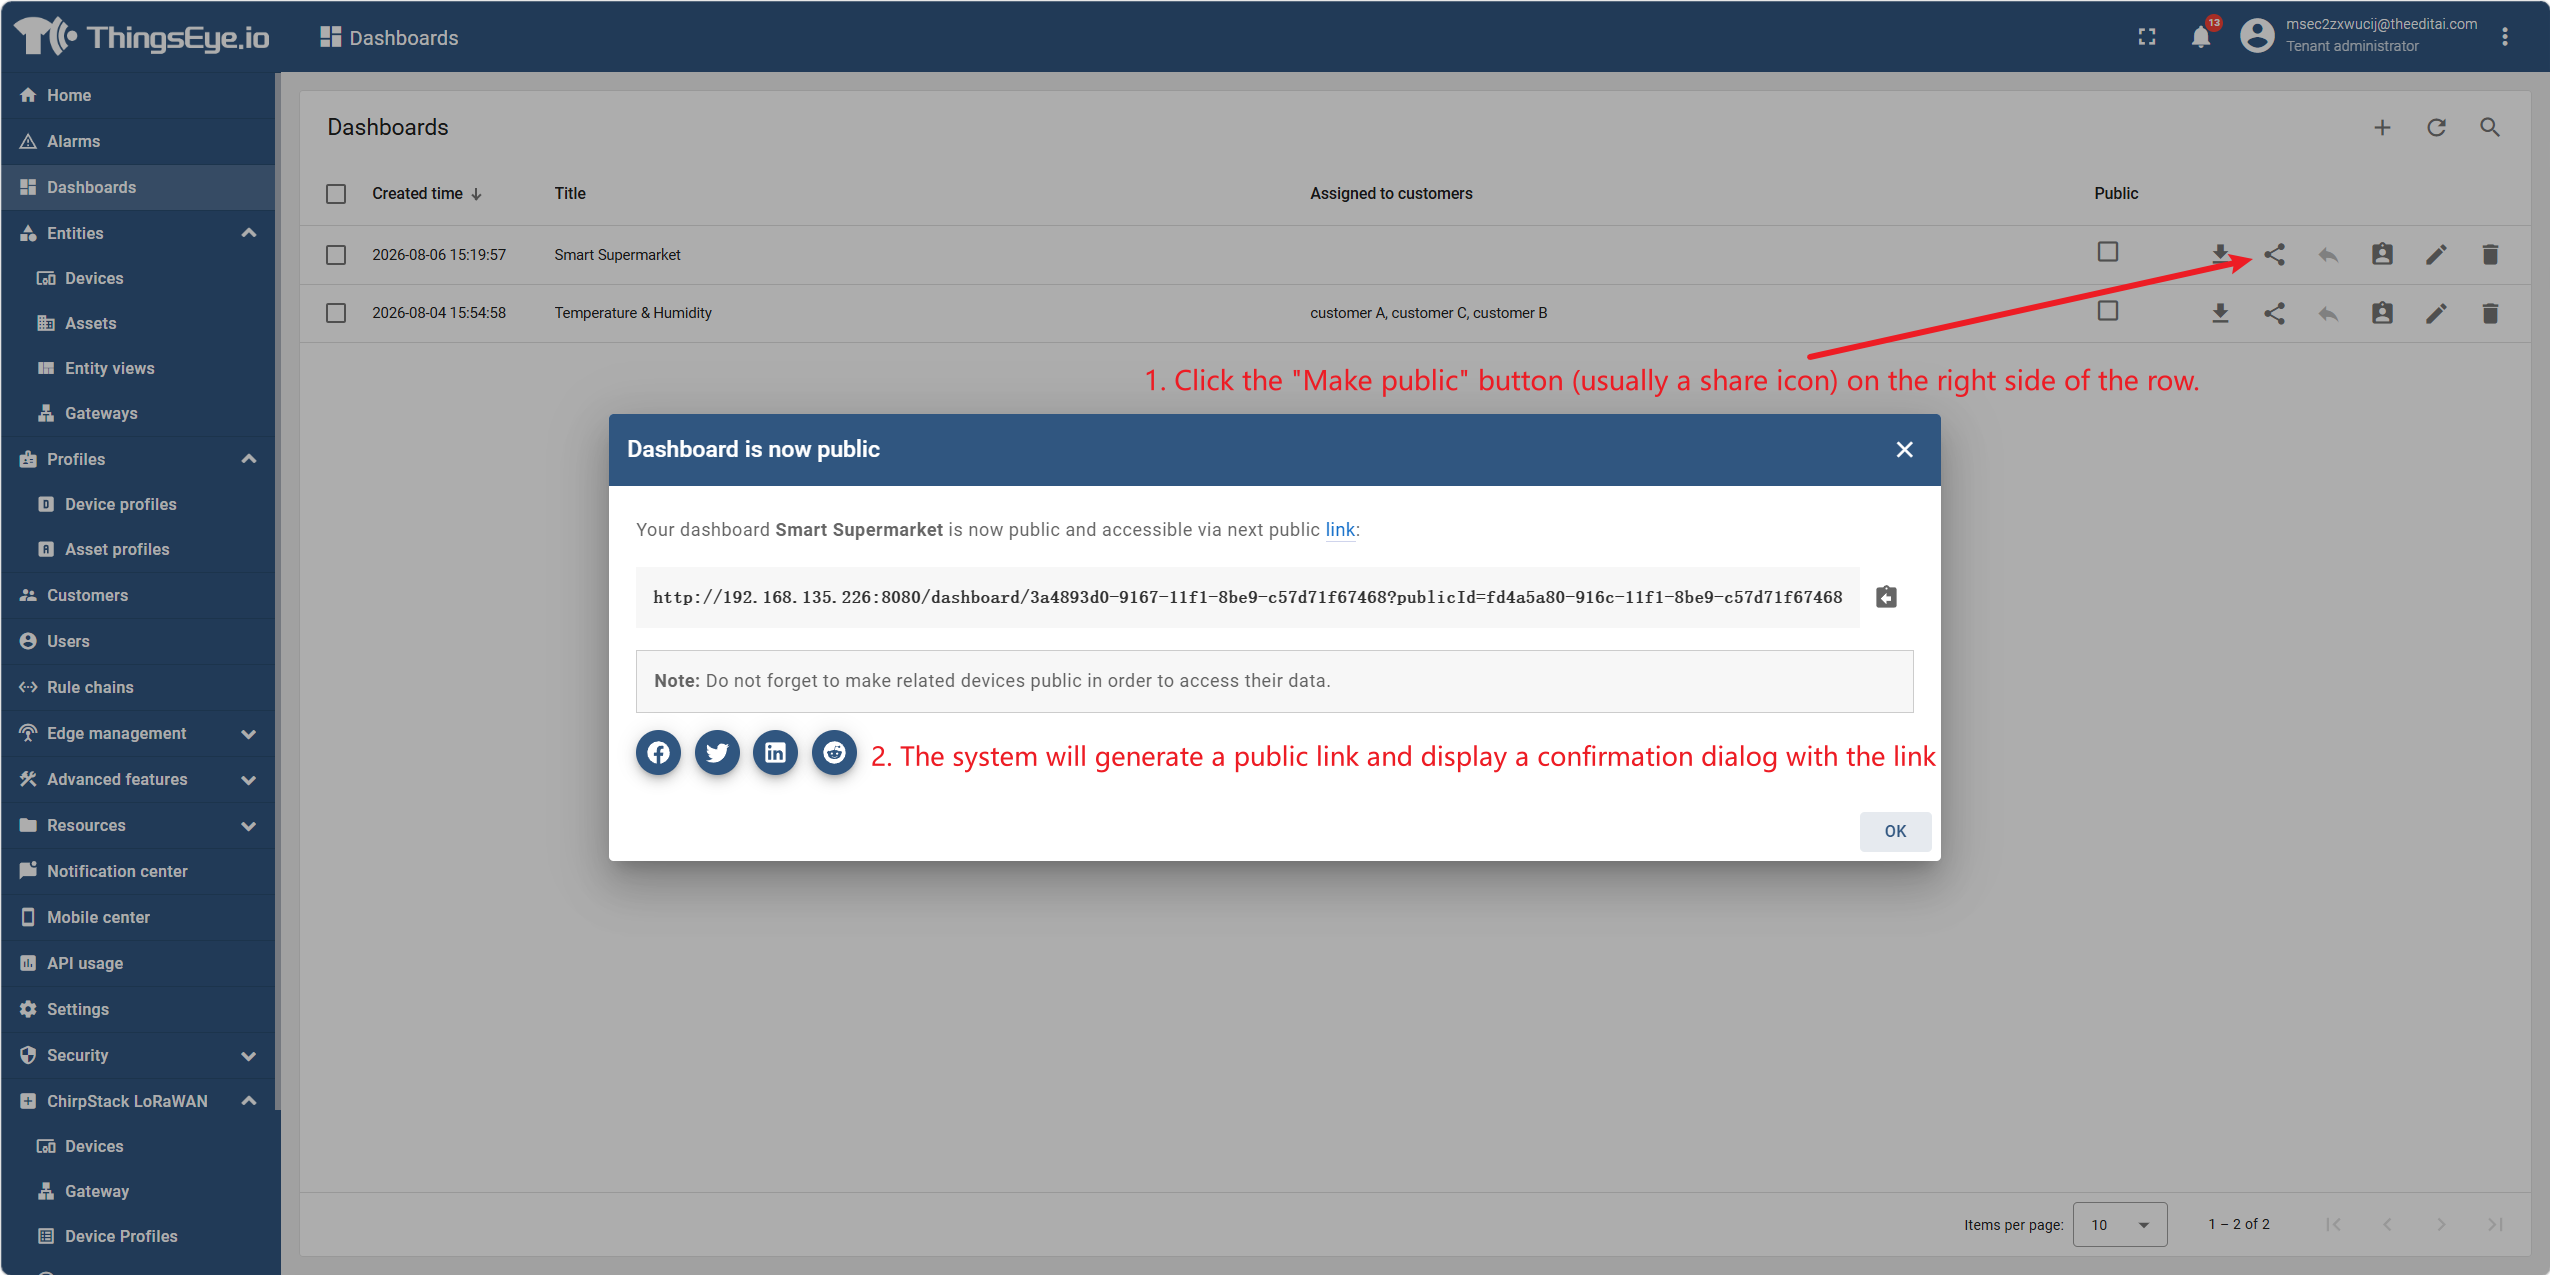
- Click the "Make Public" button on the right side of the row (usually a share icon).
- The system generates a public link and displays it in the confirmation dialog, for example:
http://link/dashboard/3a4893d0-9167-11f1-8be9-c57d71f67468?publicId=fd4a5a80-916c-11f1-8be9-c57d71f67468 - Click "Copy Public Link" to copy and share the link.
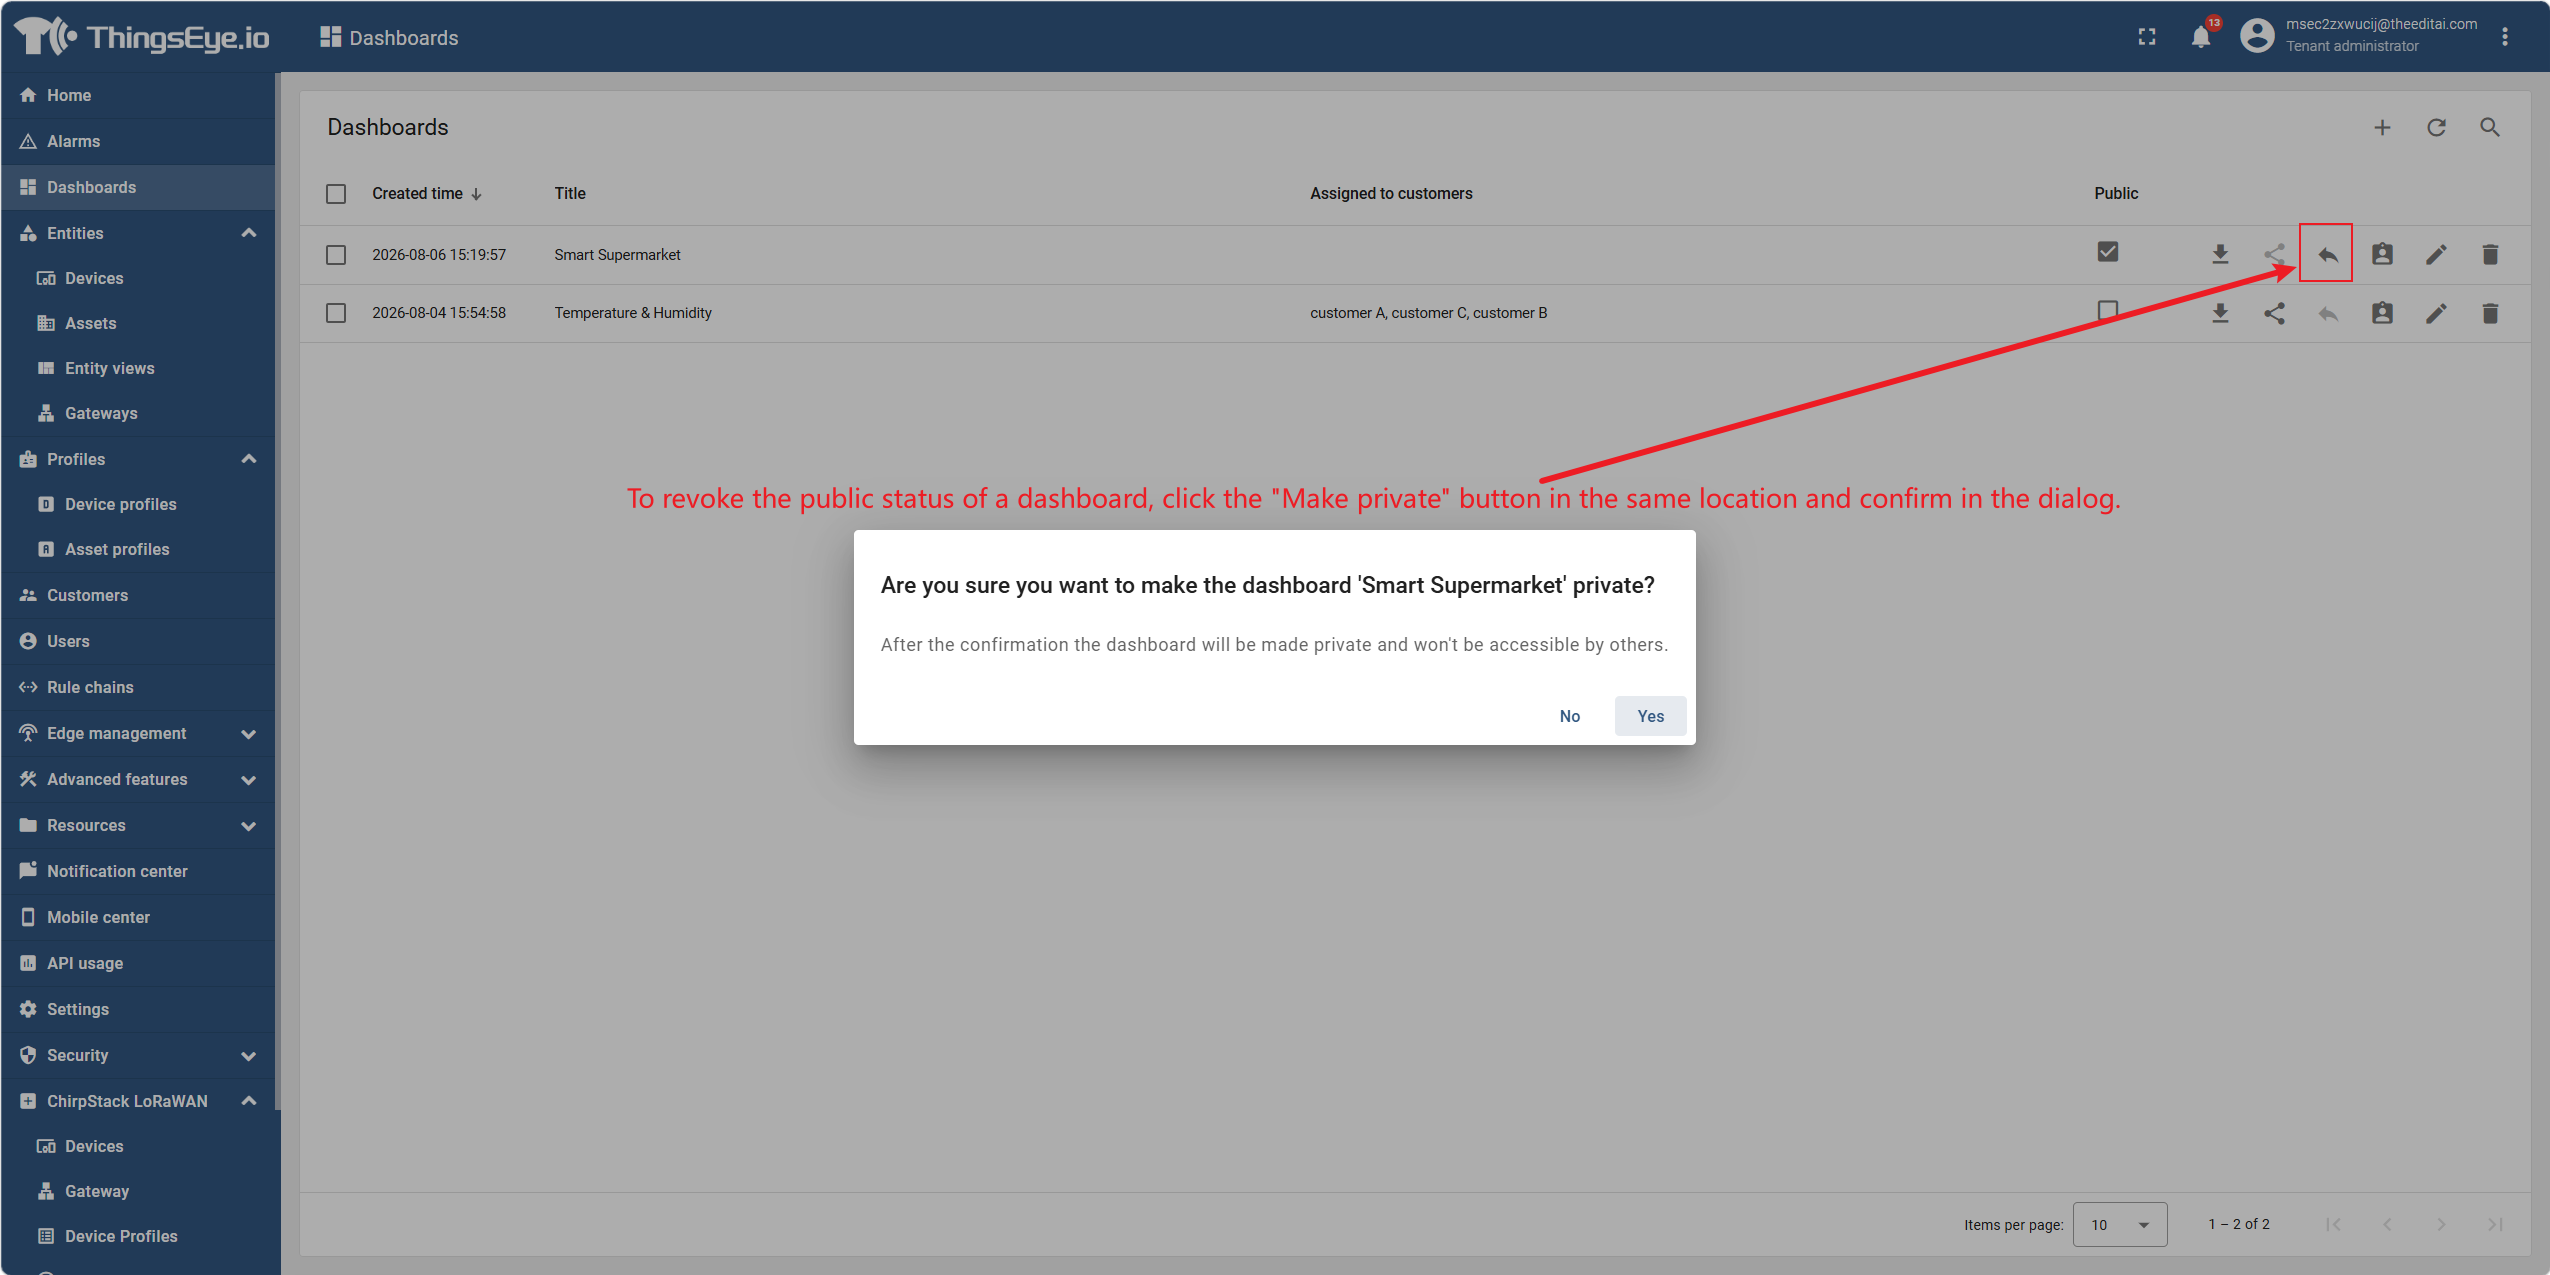
Revoke public status: To revoke the public status of a dashboard, click the "Revoke Public" button in the same location and confirm in the dialog.
Method 2: Assign to Customer
Procedure:
- Go to the "Dashboards" list page.
- Find the row of the target dashboard.
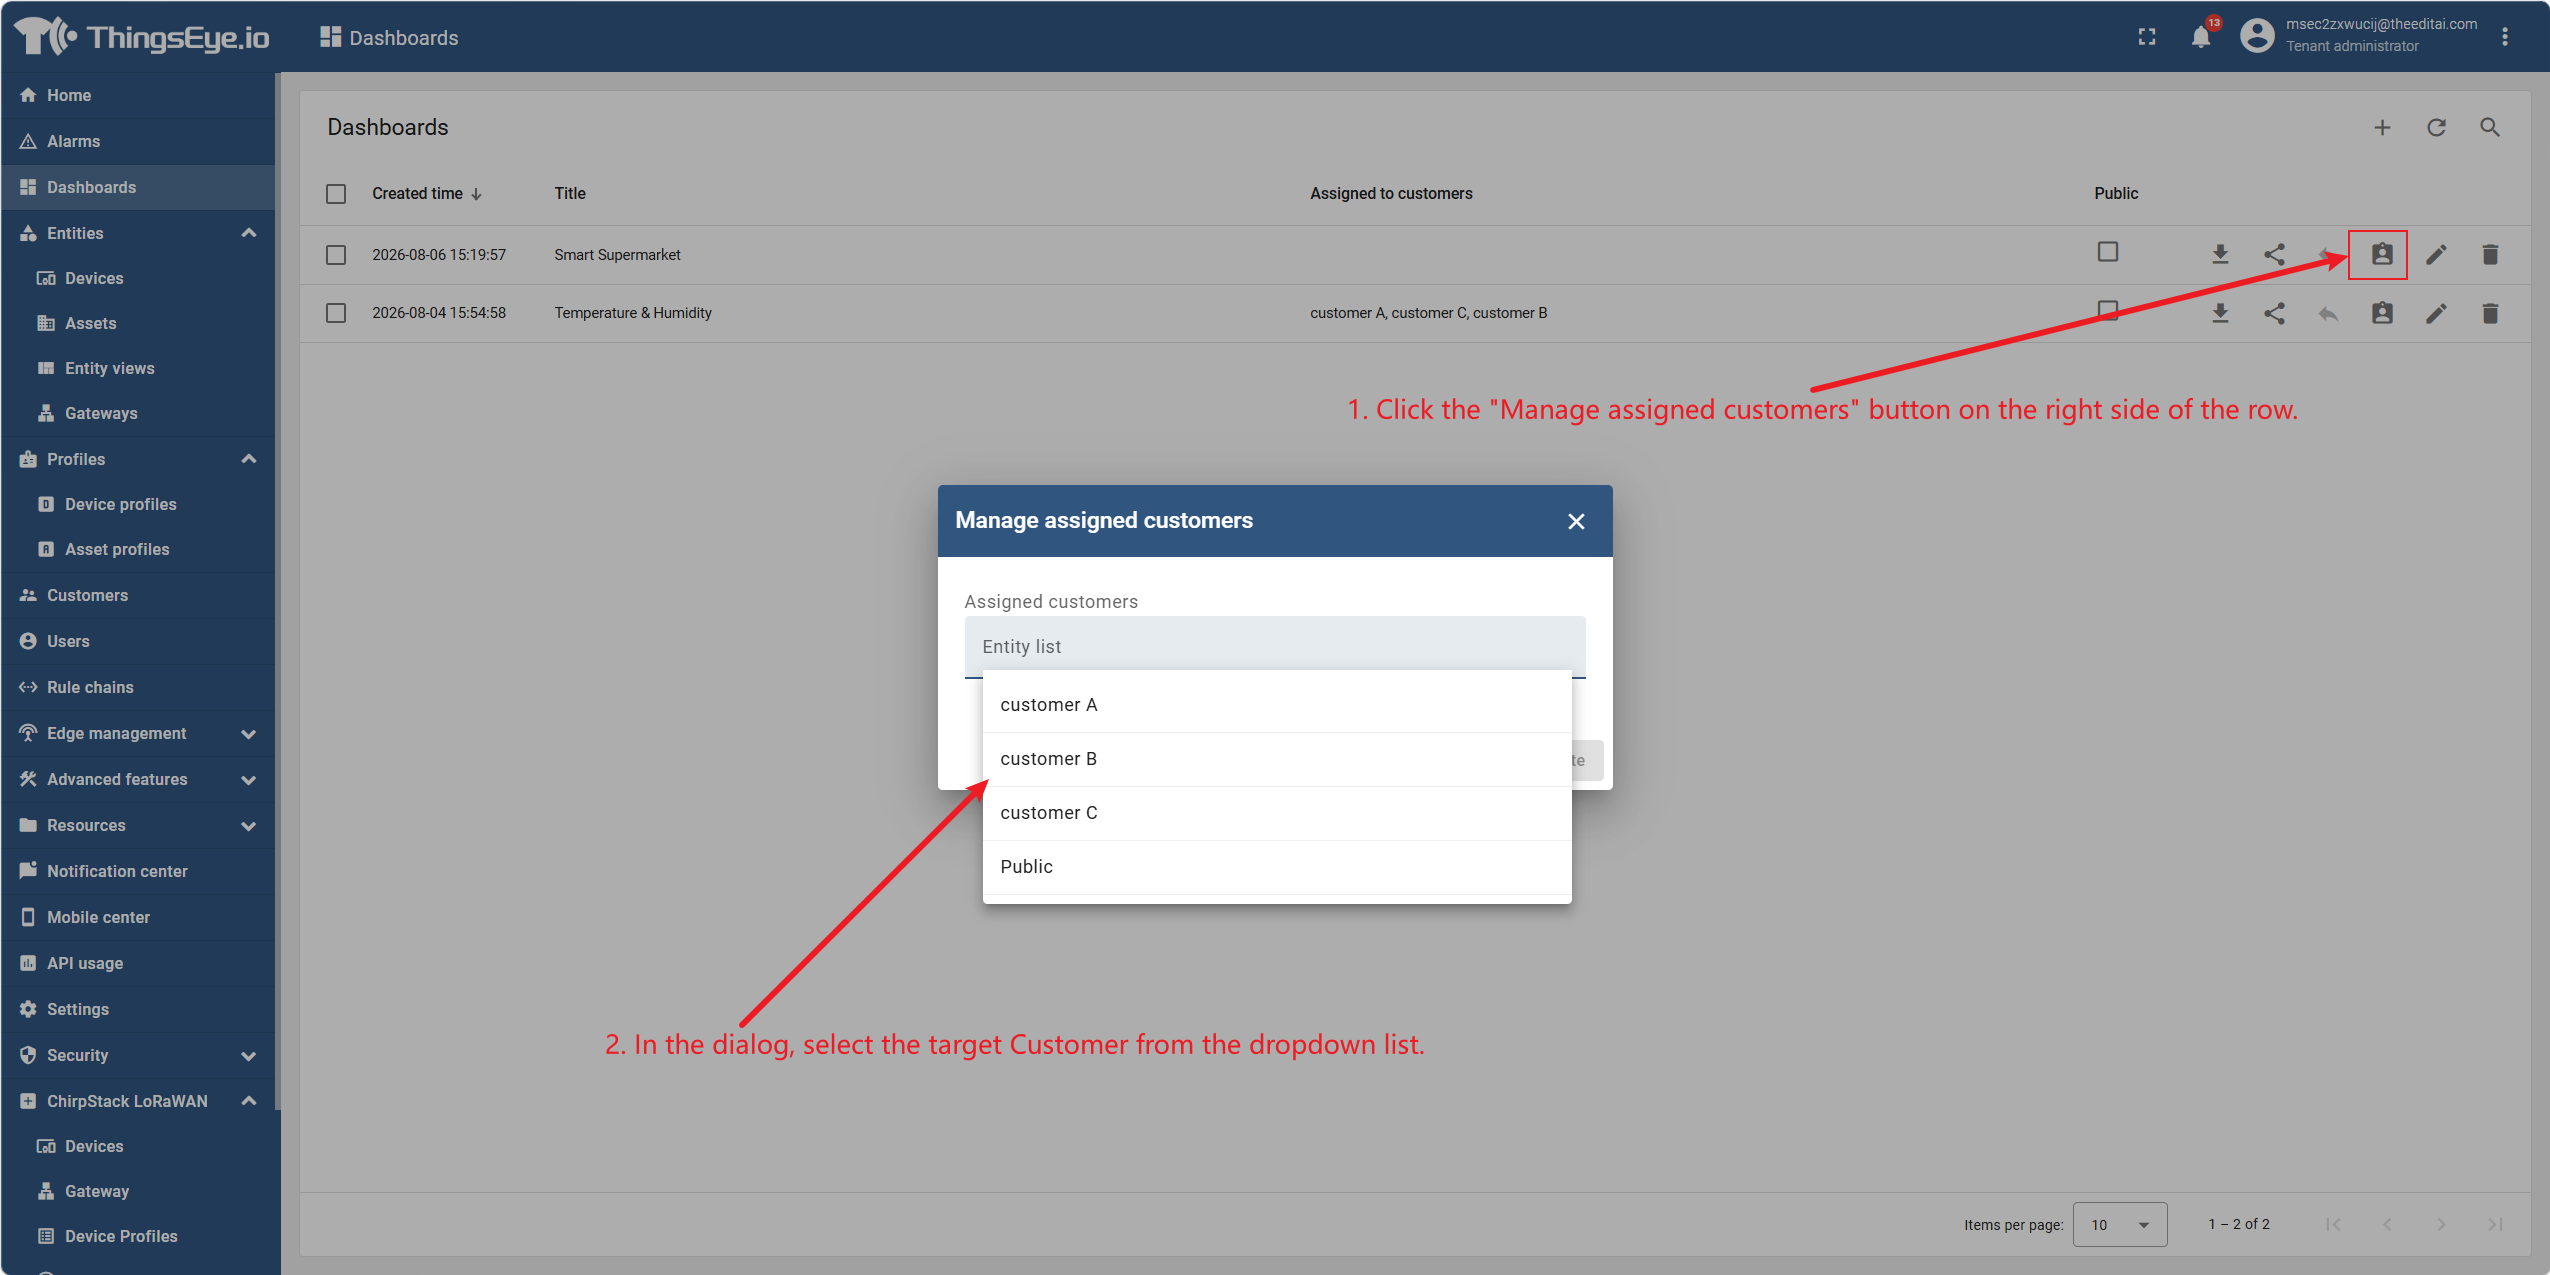
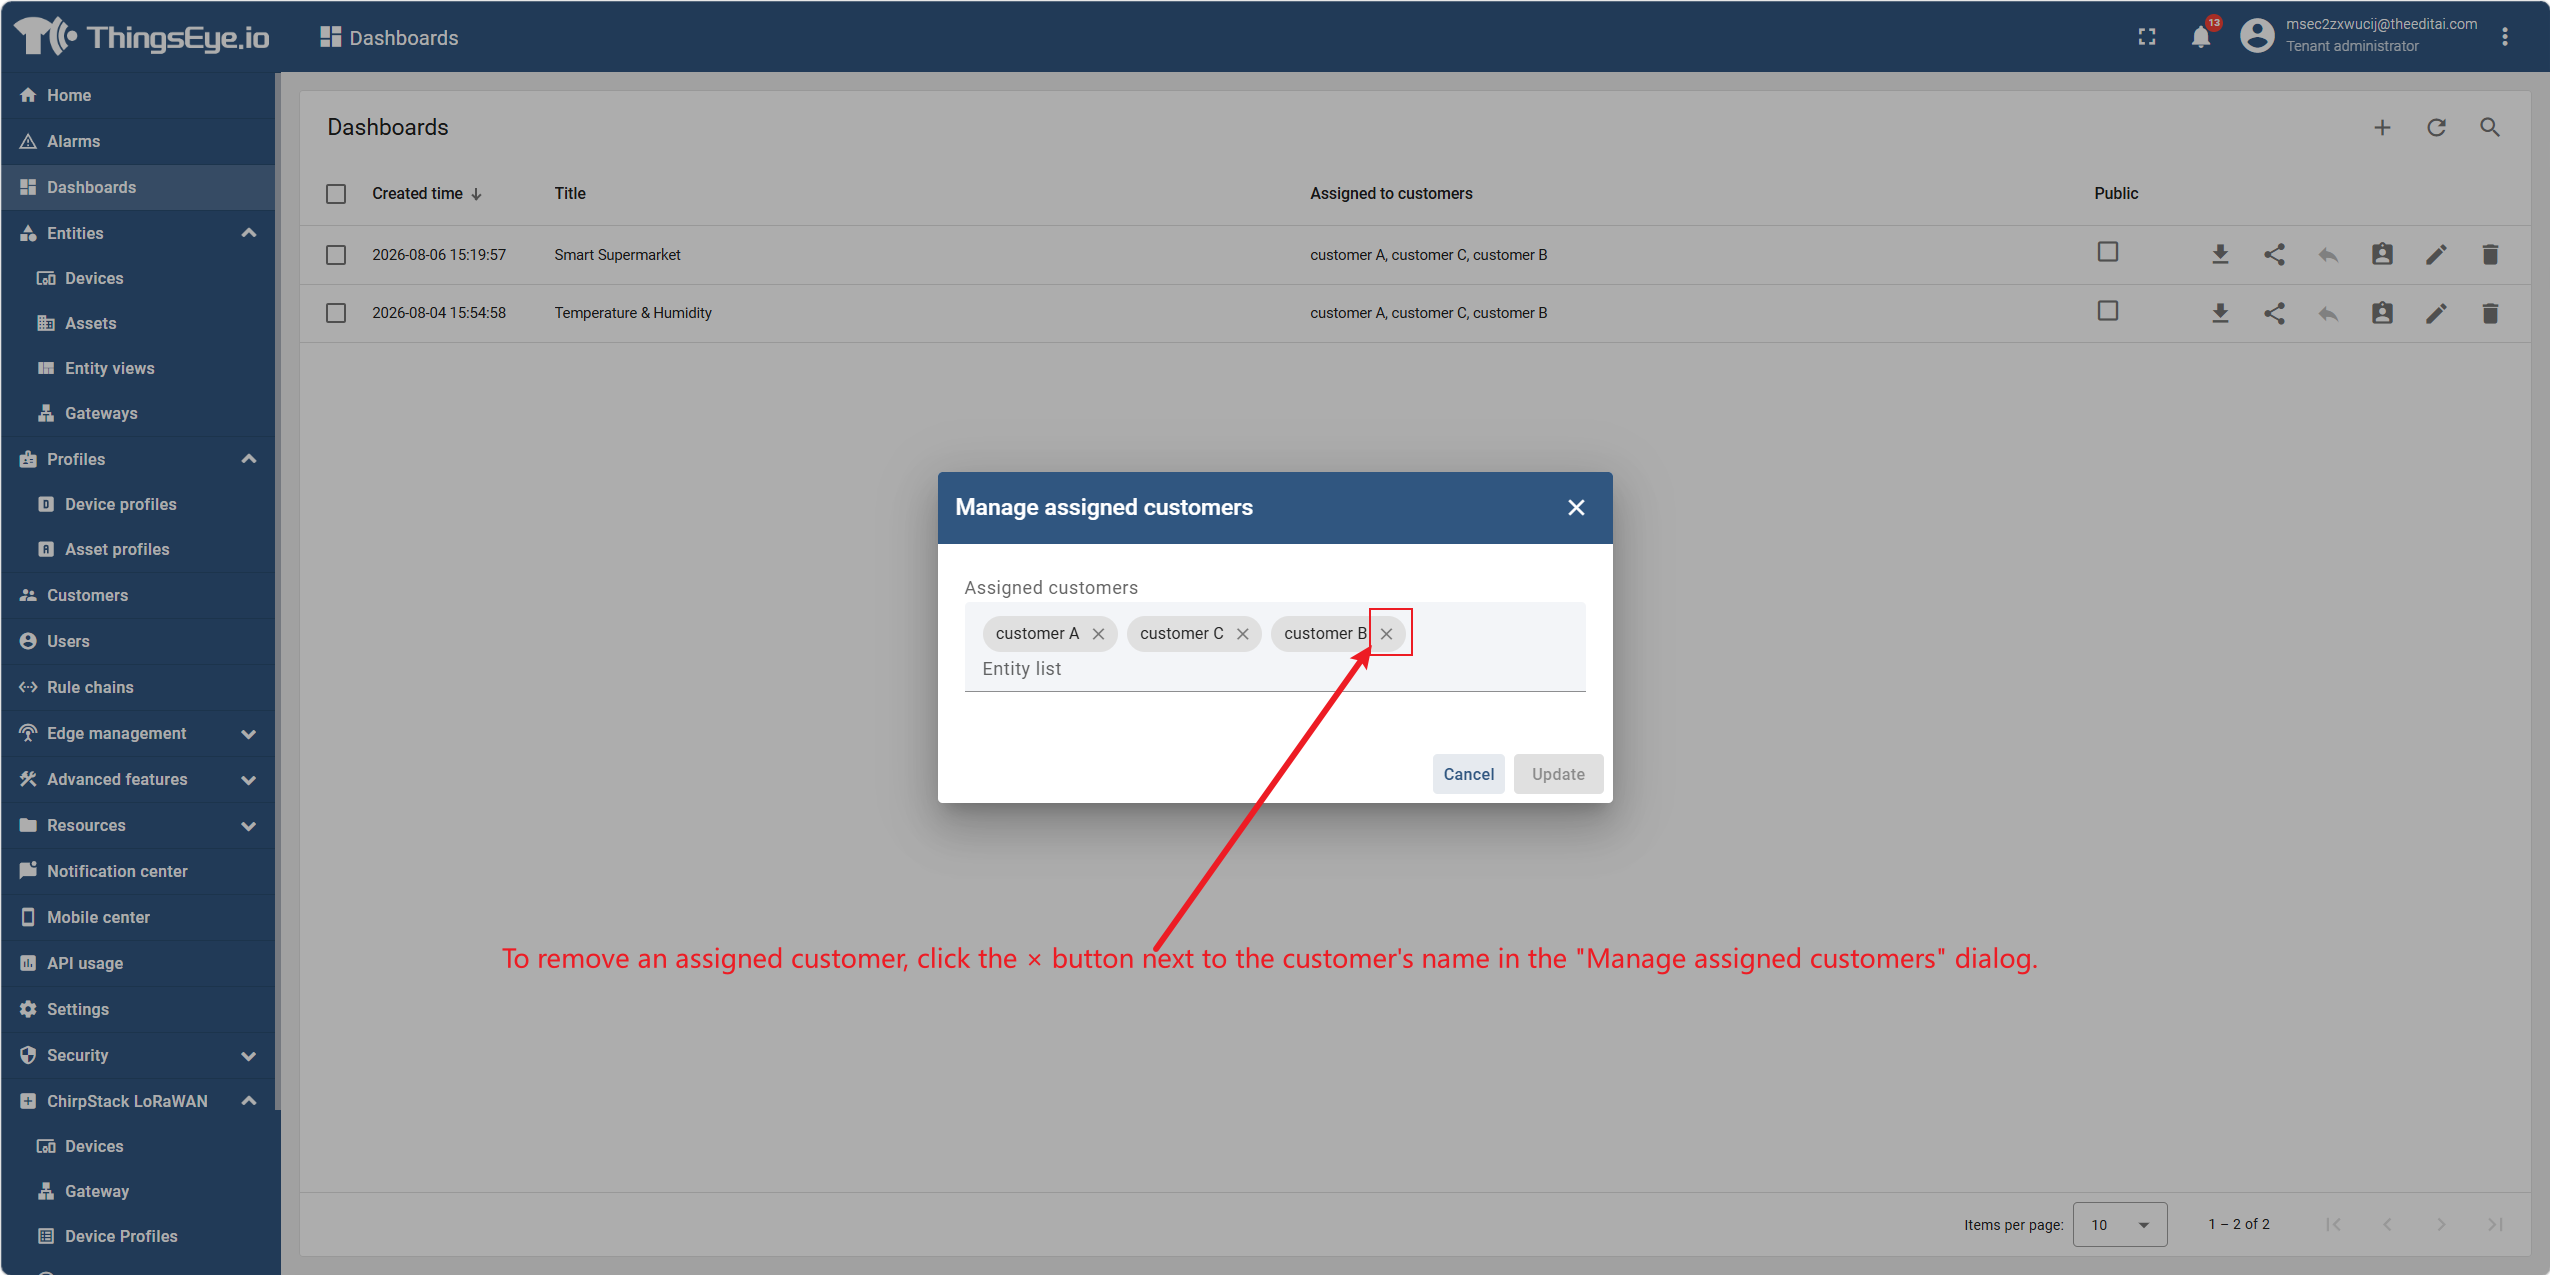
- Click the "Manage Assigned Customers" button on the right side of the row.
- In the dialog, select the target customer from the dropdown list.
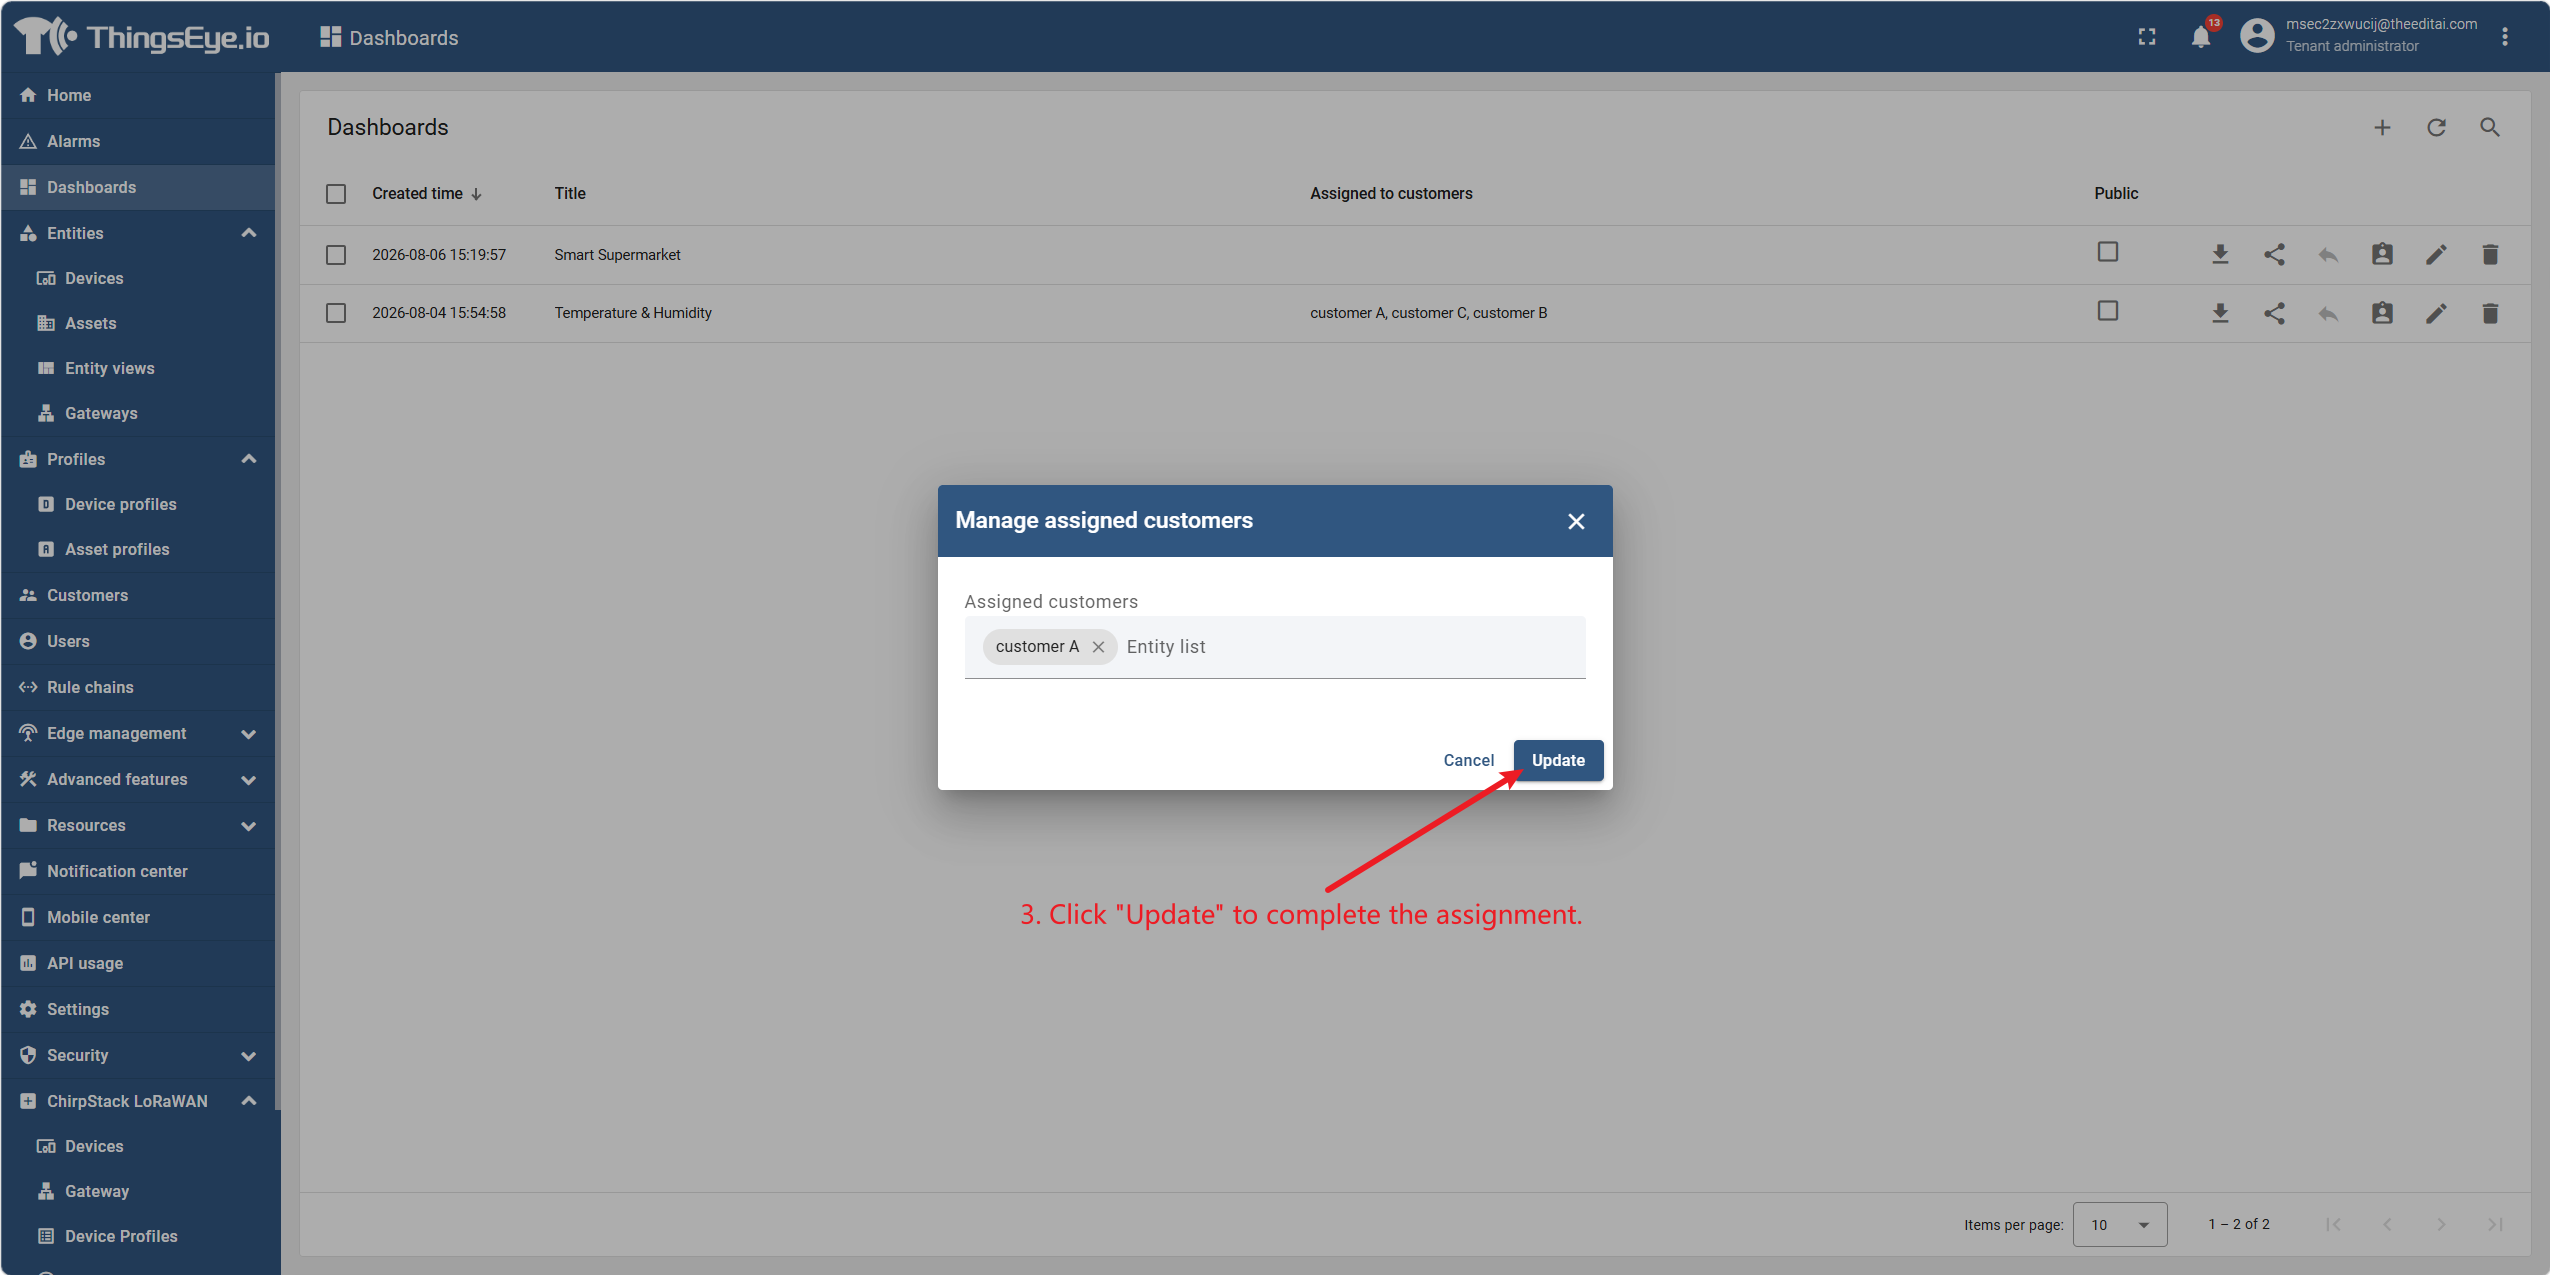
- Click "Update" to complete the assignment.
Remove a customer:
To remove an assigned customer, click the × button next to the customer name in the "Manage Assigned Customers" dialog.
Important Considerations
1. Devices must also be shared
Regardless of which sharing method you use, if the dashboard displays device telemetry data, you must ensure that the relevant devices are also visible to the target users or public access; otherwise, the dashboard will not display data.
2. Differences between the two methods
| Comparison Item | Public | Assign to Customer |
|---|---|---|
| Login required | No | Yes |
| Access method | Direct access via public link | View in dashboard list after login |
| Use case | External display, large‑screen dashboards, scenarios without accounts | Internal platform users, scenarios requiring authentication and access control |
3. Obtaining the public link
After the public link is generated, in addition to copying it from the confirmation dialog, it can also be viewed at any time in the dashboard's "Details" panel.
Supplementary Note: Sharing Devices and Assets
The sharing logic for devices and assets is similar to that of dashboards, but the entry points are different:
| Entity Type | Sharing Entry | Operation Description |
|---|---|---|
| Device | Row in device list → "Make Public" or "Manage Assigned Customers" | Exactly the same logic as dashboards; make a device public or assign it to a specific customer |
| Asset | Row in asset list → "Make Public" or "Manage Assigned Customers" | Exactly the same logic as dashboards; make an asset public or assign it to a specific customer |
Important Note: If a dashboard displays telemetry data from devices or assets, it is not enough to only make the dashboard public or assign it to a customer. You must share all devices and assets referenced in the dashboard using the same method (public or assigned to the same customer); otherwise, the widgets in the dashboard will fail to load data.